Fig. 5.

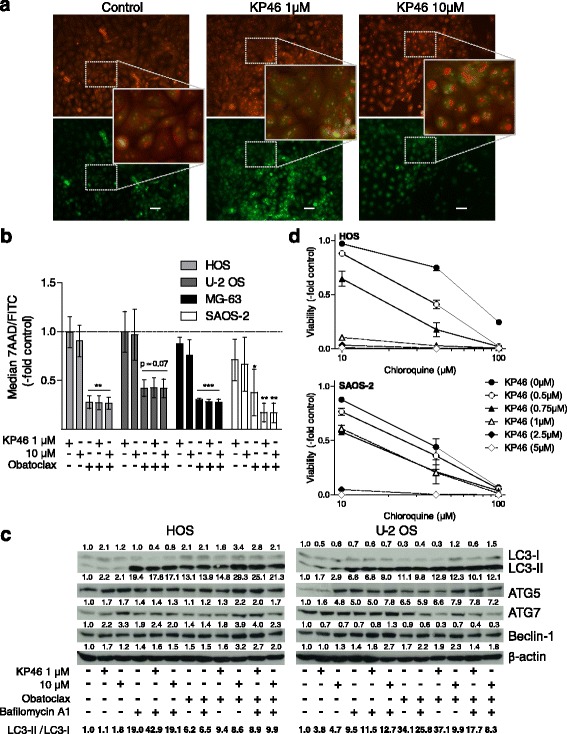
KP46 treatment induces autophagy and synergizes with downstream autophagy inhibitors. a HOS cells treated with KP46 for 24 h at the indicated concentrations were stained with AO and fluorescence images taken in the green (FL1) and deep red (FL3) channel. KP46 induces the formation of large acidic vesicles stained in deep red. For combination experiments with obatoclax compare Additional file 2: Figure S2B. Size bar, 50 μm. b Cells treated with KP46 alone and in combination with the downstream autophagy inhibitor obatoxlax at the indicated concentrations were measured for green and red fluorescence by FACS. Red (FL3) to green (FL1) fluorescence ratios derived from three independent experiments are given. c The impact of KP46 alone and in combination with the downstream autophagy inhibitors obatoclax and bafilomycin (250 nM and 5 nM, respectively, 24 h drug exposure) on the expression of the indicated autophagy regulatory proteins and processing of LC3-I to LC3-II was determined by Western blot. Density of the respective bands was evaluated corrected for β-actin expression. Data are given normalized to the untreated controls. The ratio of LC3-II/LC3-I also as a measure of autophagic flux in the combination setting by the method of Chittaranjan et al. [24] is depicted at the bottom line as indicated. d Cell viability after combined treatment of OS cells with KP46 and the autophagy inhibitor chloroquine for 72 h at the indicated concentrations was determined by MTT survival assay. Dose response curves for HOS and SAOS-2 cells derived from two independent experiments in triplicate are shown representatively. For the respective CI values compare Additional file 3: Figure S3. Student’s t-test; * p < 0.05; ** p < 0.01; *** p < 0.001
