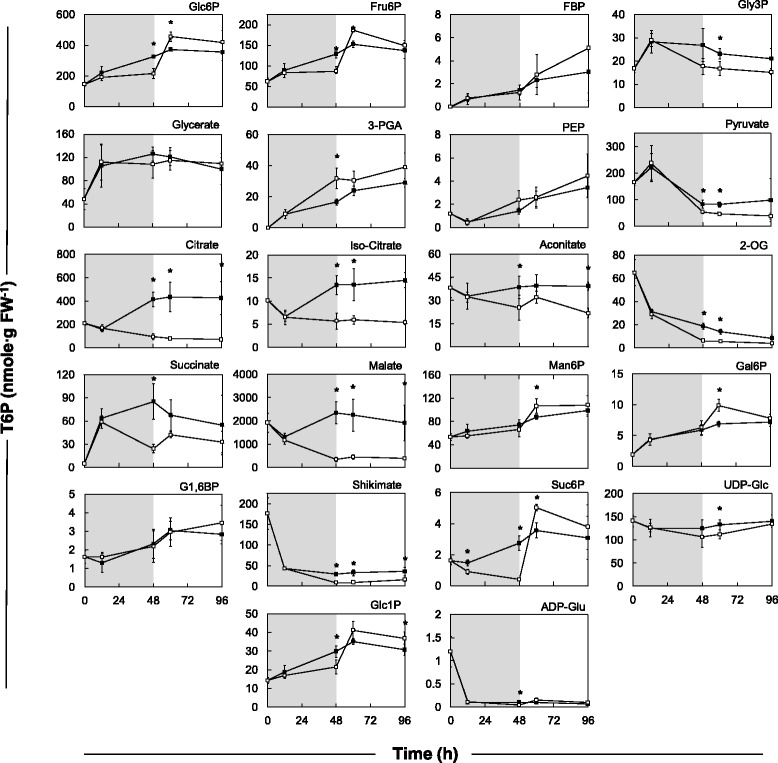
Fig. 2.

Effects of sucrose starvation on metabolite levels (on a fresh weight basis) on 3 DAP B73 kernels (2012 season). All metabolites were measured using anion exchange chromatography in tandem with mass spectrometry as described by Lunn et al. [18]. Control kernels on continuous sucrose are indicated with closed squares. Kernels starved for 48 h (shaded area), then allowed to recover for 48 H on 150 mM sucrose are indicated with open squares. Means are calculated using 4 biological replicates, consisting of 3 plants each. Significance as indicated by asterisks was determined by the Student’s t test (P < 0.05)
