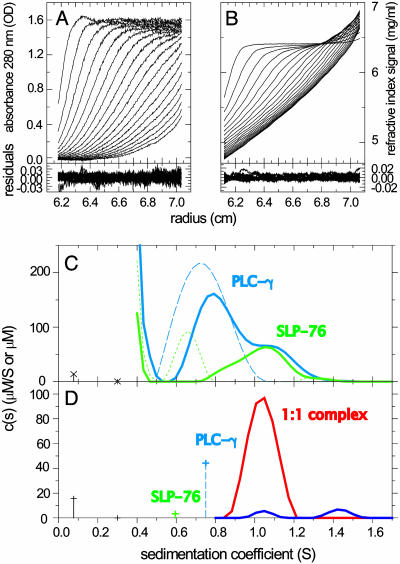
Fig. 3.
Analysis of the interaction of peptides derived from the adaptor protein SLP-76 and PLCγ1. SLP-76 contains only one tyrosine and no tryptophan residues, allowing its spectral discrimination from PLCγ1. (A and B) Absorbance and interference optical signal distributions of a mixture of SLP-76 and PLCγ2 at time intervals of 2,500 sec at a rotor speed of 59,000 rpm and a temperature of 4°C, with systematic noise subtracted. The residuals are from the fit with the hybrid discrete/continuous model shown in D (see below). (C) Data in the same configuration as shown in A and B were collected for SLP-76 and PLCγ1 separately (data not shown), which led to the component distributions shown as a blue dashed trace for PLCγ1 (molar extinction coefficient, 20,060 OD280/Mcm; Fk,w = 1.5) and a green dotted trace for SLP-76 (molar extinction coefficient, 2,550 OD280/Mcm; Fk,w = 2.3). Alternatively, the data of SLP-76 and PLCγ1 alone could be modeled well as discrete sedimenting species with 0.6 and 0.75 S, respectively. Shown is an analysis of the mixture with component sedimentation coefficient distributions for SLP-76 (green solid trace) and PLCγ1 (blue solid trace), with a uniform frictional ratio of Fk,w = 2.0. (D) Analysis with subdivision of the s values in three ranges: (i) the buffer components at <0.4 S; (ii) the discrete free peptides with their predetermined extinction properties, molar masses, and predetermined s values of 0.6 and 0.75 S; and (iii) the continuous distribution of complexes >0.8 S, which can be constrained in their spectral properties to reflect stoichiometries of 1:1 (red trace) or 2:1 (blue trace). The interference optical data contain contributions from the sedimentation of a small buffer component (likely predominantly optically unmatched NaCl), which can be modeled well as discrete species at 0.08 and 0.3 S (black crosses with dropped lines). All units for s values are S at experimental conditions, the concentration of discrete species are in μM, and the ck(s) distributions are in μM/S.

