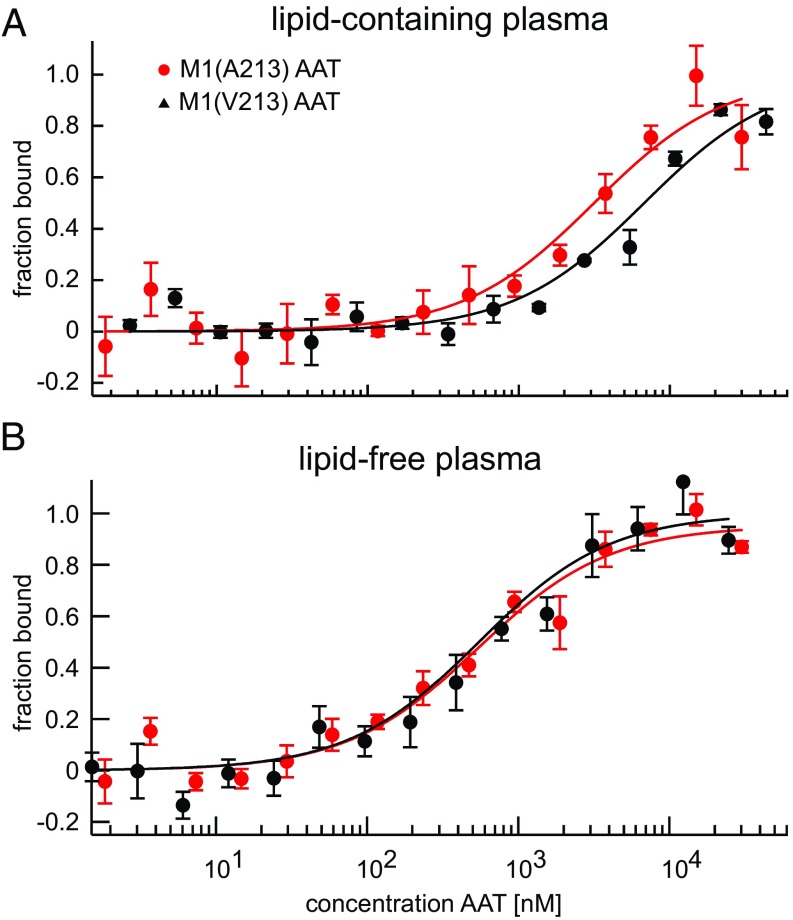
Fig. 3.
Functional differences between M1 AAT variants found in lipid-containing, but not lipid-free, plasma. Shown are the fitted binding curves of the microscale thermophoresis assay under equilibrium conditions in lipid-containing (A) and lipid-free (B) plasma. A fixed concentration of fluorescently labeled and catalytically inactive NE was titrated with the M1(A213) or M1(V213) variant in AAT-deficient plasma. (A) In the presence of lipids, the KD (KD) observed with the M1(V213) variant [KD(A213) = 6,800 ± 1000 nM] was substantially higher than the KD observed with the M1(A213) variant [KD(V213) = 3,200 ± 500 nM]. (B) In the absence of lipids, there was no discernible difference between the two variants [KD(A213) = 540 ± 50 nM; KD(V213) = 550 ± 60 nM]. Fitted binding curves and KD values (mean ± SD) were derived from global fitting of three measurements (three independent protein expressions). The measurements were performed in 7.5% plasma and with 5 nM labeled NE.

