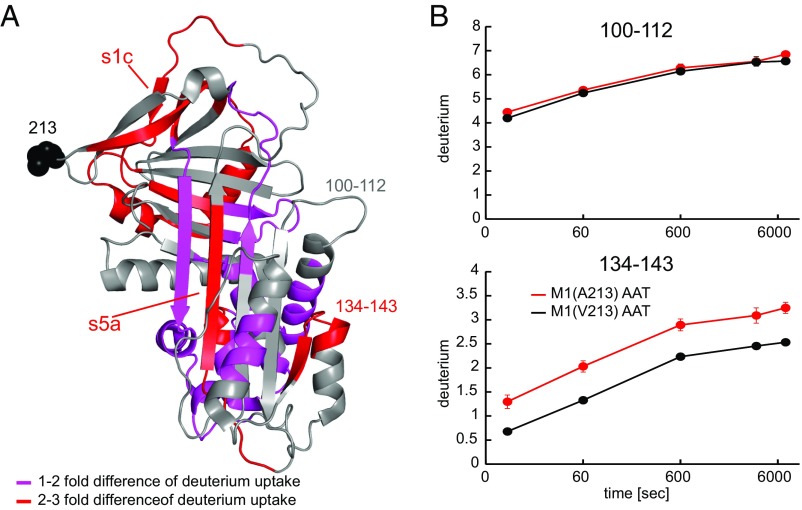
Fig. 4.
Differences in hydrogen/deuterium exchange kinetics between M1(A213) and M1(V213) AAT. (A) Shown is the cumulative difference across five time points (10 s to 120 min) in deuterium uptake between M1(A213) and M1(V213) mapped onto the crystal structure of AAT (Protein Data Bank ID code 1QLP). Peptides displaying a significant increase in deuterium uptake in M1(A213) compared with M1(V213) are colored red (two- to threefold increase) and pink (one- to twofold increase). Otherwise, there was no significant difference in deuterium uptake between the two variants, such as the stretch between positions 100 and 112 (gray arrow). Substitution of Ala for Val at position 213 results in subtle but widespread destabilization of AAT. (B) Example kinetic curves for the deuterium uptake with two peptides. Peptide 134–143 (Lower) displays a significantly higher deuterium uptake in the M1(A213) AAT variant compared with M1(V213), whereas no significant difference is seen with peptide 100–112 (Upper). Values represent means from three different measurements.

