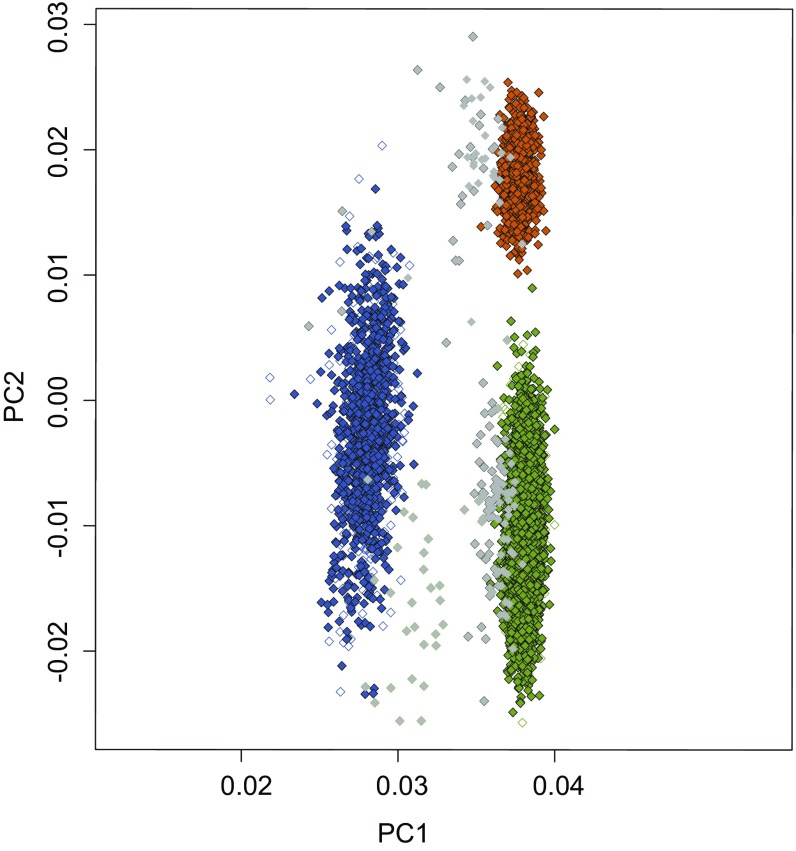
Fig. S1.
Outlier analysis by PC analysis. German, UK, Australian, and South Asian samples were checked to remove potential outliers with respect to genetic background. Green with black outline, German cases; white with green outline, Kooperative Gesundheitsforschung in der Region Augsburg (KORA) controls; blue with black outline, UK/Australian cases; white with blue outline, Wellcome Trust Case Control Consortium 2 controls; orange with black outline, Pakistan cases; white with orange outline, Pakistan controls. Samples in gray were removed from the analysis after visual inspection. PC1 and PC2 are displayed on the x axis and y axis, respectively.

