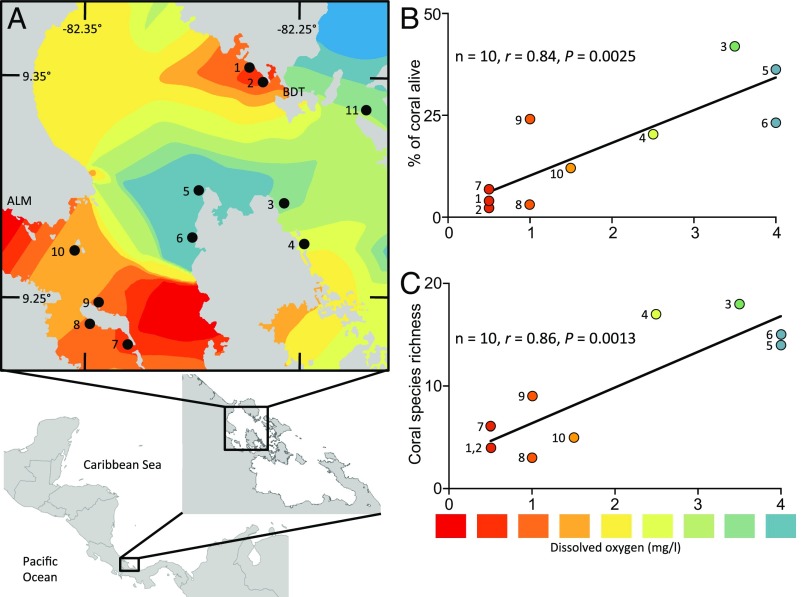
Fig. 2.
Spatial distribution of hypoxia at 10–12 m depth (October 2010) and its consequences. (A) There were two distinct pockets of hypoxia, one near the mainland with terrestrial inputs [lower left, near Almirante town (ALM)], and the other near dense settlements of Bocas del Toro (BDT) where the Bocas del Toro Research Station is located. Land is shown in gray. Color indicates the intensity of hypoxia as shown in the scale in the figure. Sites 1 and 11 were initial reef-assessment sites (2010–2011); sites 1–10 were 10 subsequent coral-survey sites (2012). (B and C) Dissolved oxygen during the hypoxic period in 2010 was correlated with both the percent of coral cover at a site that was alive (B) and species richness of coral remaining alive in 2012 (C). Data were analyzed by Pearson’s correlation. Note that dissolved oxygen levels were always >4.8 mg/L at the shallow depth (3–4 m) (Fig. S1A).

