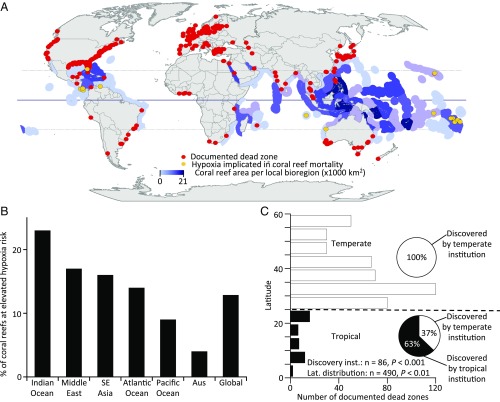
Fig. 4.
Worldwide distribution of dead zones and coral reefs. (A) Global map with all known dead zones (red dots) and coral reefs where hypoxia has been implicated in mass mortality of reef organisms (gold dots). Documented dead zones are notably concentrated in temperate regions in areas with relatively greater research capacity, whereas coral reefs are found primarily in the tropics. The solid horizontal line represents the equator, and the upper and lower dashed lines represent the Tropics of Cancer and Capricorn respectively. Intensity of purple color indicates densities of coral reef area per ecoregion, from lightest to darkest: 0, 1–1,000, 1,001–2,500, 2,501–5,000, 5,001–10,000, and 10,001–21,000 km2. (B) The proportion of coral reefs at elevated risk of hypoxia, for each major coral region and a global average weighted by relative coral area in each region, based on coastal geomorphology and anthropogenic drivers of low oxygen. (C) The distribution of dead zones by latitude. Dead zones are relatively underrepresented in tropical regions and are overrepresented in temperate areas given the length of the coastline in each region (analysis by Kolmogorov–Smirnov test). Degrees of latitude are absolute values, so northern and southern hemisphere latitudes are pooled. (Insets) Circle graphs show that tropical dead zones were likely to be first identified by research teams from temperate institutions, whereas temperate dead zones were never identified by teams from tropical institutions (analysis by χ2 test).

