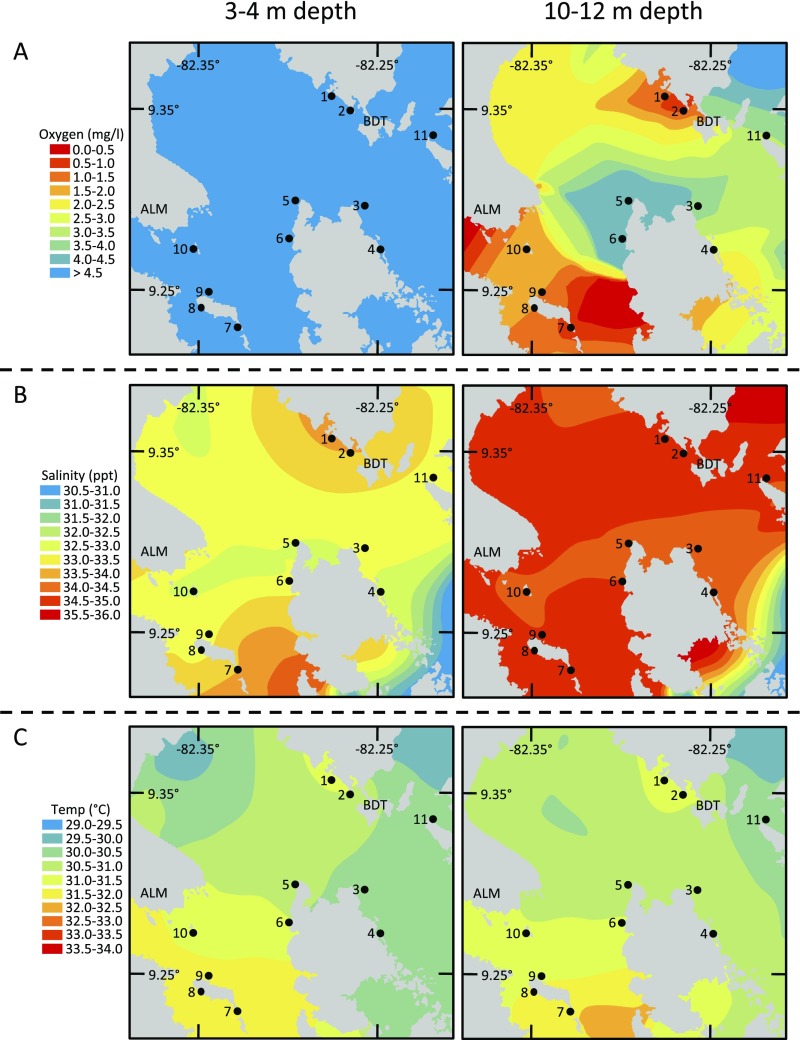
Fig. S1.
Maps of water quality in shallow (Left) and deep (Right) water during the hypoxic period in October 2010. Data are shown for (A) oxygen, (B) salinity, and (C) temperature. Consistent differences between depths in oxygen and salinity indicate the stratification of the water column. The map of oxygen at 10–12 m is the same as in Fig. 2.

