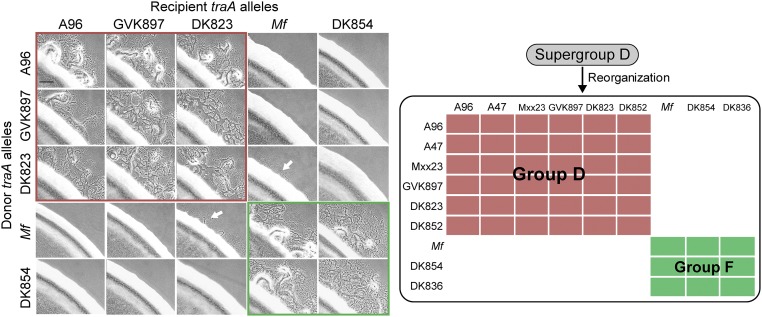
Fig. S4.
Reassignment of supergroup D into two recognition groups: D and F. Interactions between indicated TraA receptors were assessed in isogenic backgrounds by stimulation assays (Left). Panels with red borders show group D members, whereas the green borders show group F members. These results were combined with lipophilic dye transfer results (4) and summarized (Right). All group D members contain an A that corresponds to residue 205 in TraAA96, whereas all group F members contain a P at this position. Alleles that were not analyzed here include receptors with identical variable domains (traAA47 and traAA96; traADK852 and traADK823) or very similar and compatible variable domains (traAMxx23 and traAA96 contain four amino acid differences, whereas traADK836 and traADK854 contain three amino acid differences). White arrows indicate poor cross-talk between receptors. (Scale bar, 200 μm.)

