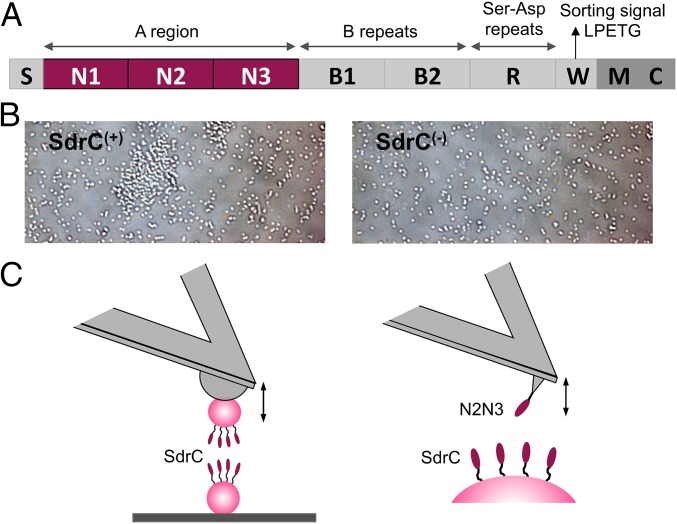
Fig. 1.
Probing SdrC homophilic adhesion from the micro- to the nanoscale. (A) Schematic representation of the SdrC structure: S, secretory signal sequence; region A comprising N1, N2, and N3 subdomains; two B regions; region R comprising serine-aspartate (Ser-Asp; SD) dipeptide repeats; and C-terminal region containing a sorting signal with an LPETG motif, a wall spanning region (W), membrane spanning region (M), and cytoplasmic tail (C). (B) Optical microscopy images of L. lactis cells expressing—or not—full-length SdrC [respectively, SdrC(+) and SdrC(−) cells] after resuspension in PBS. (C) Force spectroscopy of the SdrC homophilic interaction. (C, Left) We used single-cell force spectroscopy to measure the forces between L. lactis SdrC(+) bacteria expressing full-length SdrC. (C, Right) Single-molecule force spectroscopy was used to probe the forces between recombinant SdrCN2N3 protein, engaged in homophilic binding, and full-length SdrC on L. lactis.

