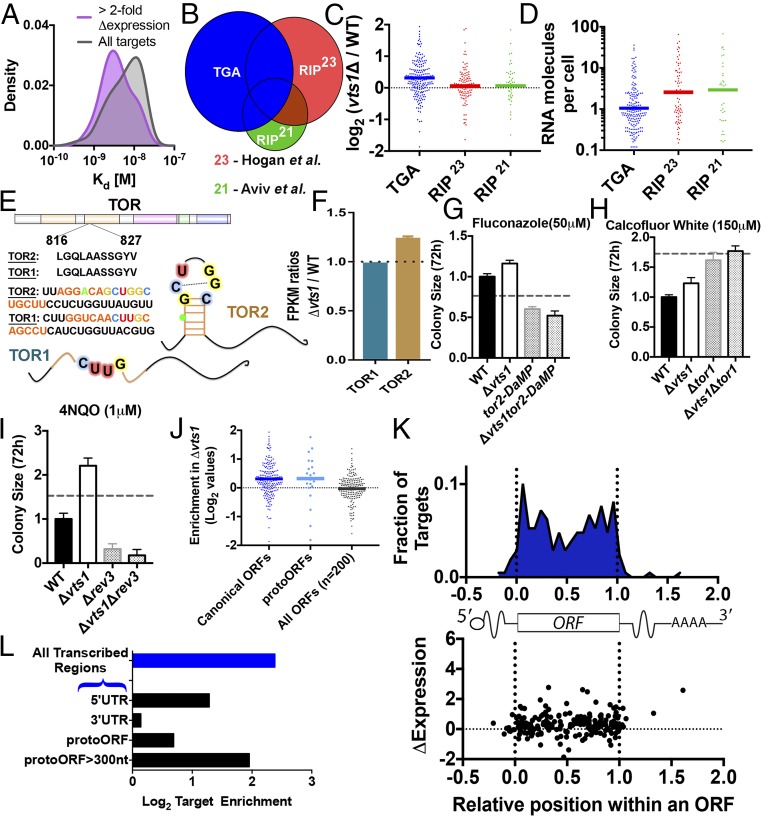
Fig. 4.
TGA reveals evidence of positive selection and enrichment in protogenes. (A) Targets with more than twofold increase in expression upon vts1 deletion (purple; smoothed density estimation, n = 20) have generally lower apparent Kd compared with all Vts1 targets identified by TGA (gray). (B and C) TGA targets (blue, nonintergenic, n = 205) are enriched vts1Δ cells compared with wild-type cells. RIP-chip targets not detected in TGA [red, n = 108, Hogan et al. (23); green, n = 43, Aviv et al. (21)] do not show enhanced expression in vts1Δ cells. The y axis in C is in log2 scale. (D) RNA abundance for TGA targets vs. RIP-chip targets. (E) Vts1 binding site is present in tor2 but not in its homolog tor1. (F) tor2 is more highly expressed in vts1Δ vs. wild type. tor1 is not (two biological replicates each; SEM). (G and H) tor2 exhibits strong negative epistasis with vts1. tor1 does not (4–16 technical replicates; SEM; dotted line represents no epistasis expectation; Materials and Methods). (I) rev3 shows negative epistasis with vts1 under DNA damage conditions. (J) RNA-seq expression for protoORF targets. (K) Metagene showing the distribution of Vts1 binding targets by position in ORF. Position in ORF is not correlated to up-regulation in vts1Δ cells. (L) Enrichment analysis based on equimolar representation of all genomic sequences. Vts1 targets are enriched in 5′-UTRs and but not in 3′-UTRs. Vts1 targets are also highly enriched on the template strand compared with the nontemplate strand (P < 10−16, binomial CDF).

