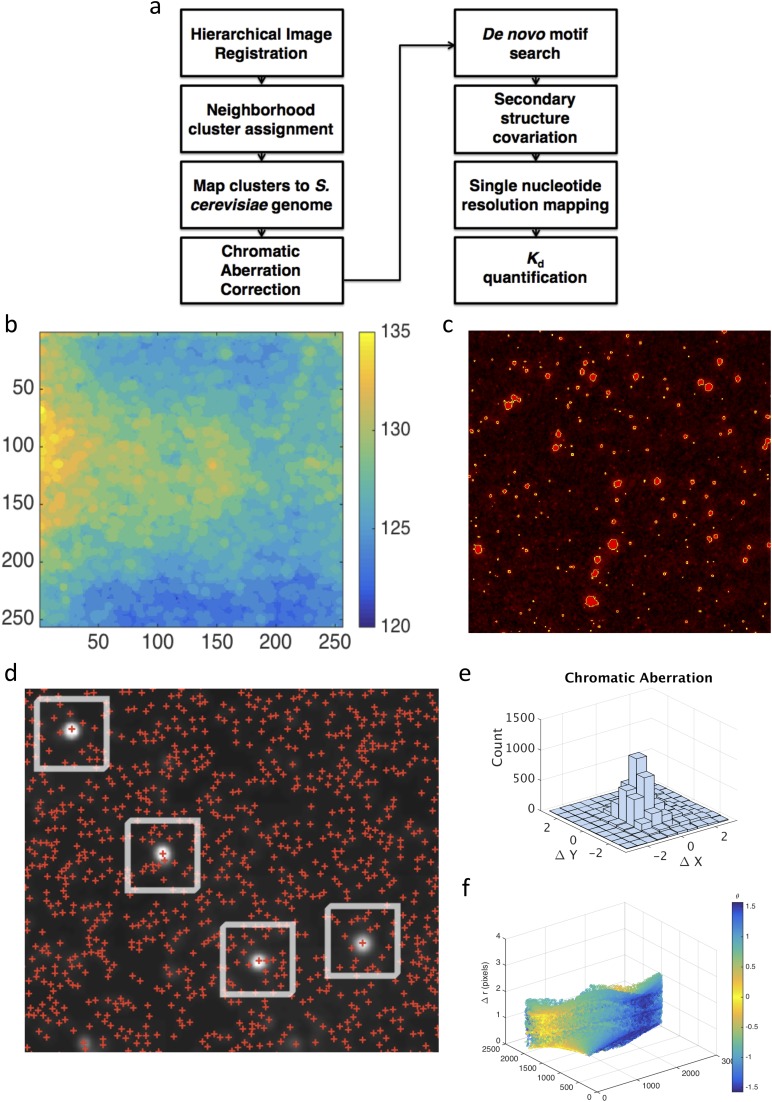
Fig. S2.
(A) High-level software flowchart for analyses performed. (B) Illumination correction via a standard MATLAB image-processing algorithm (morphological opening with disk radius of 25 pixels). (C) Image segmentation is performed via a manually adjusted threshold value and filtered for object size. (D) Neighborhood mapping method defines candidate sequencing clusters [red plus signs (+)] within a 10-pixel radius of a Vts1-binding event (white disks). Each cluster is then mapped to the S. cerevisiae genome. On-target binding substrates are identified based on reproducible, strand-specific peaks with >12 independent binding clusters. (E and F) Chromatic aberration between red (RNA) and green (protein) channel images is then plotted in Cartesian and polar coordinates.

