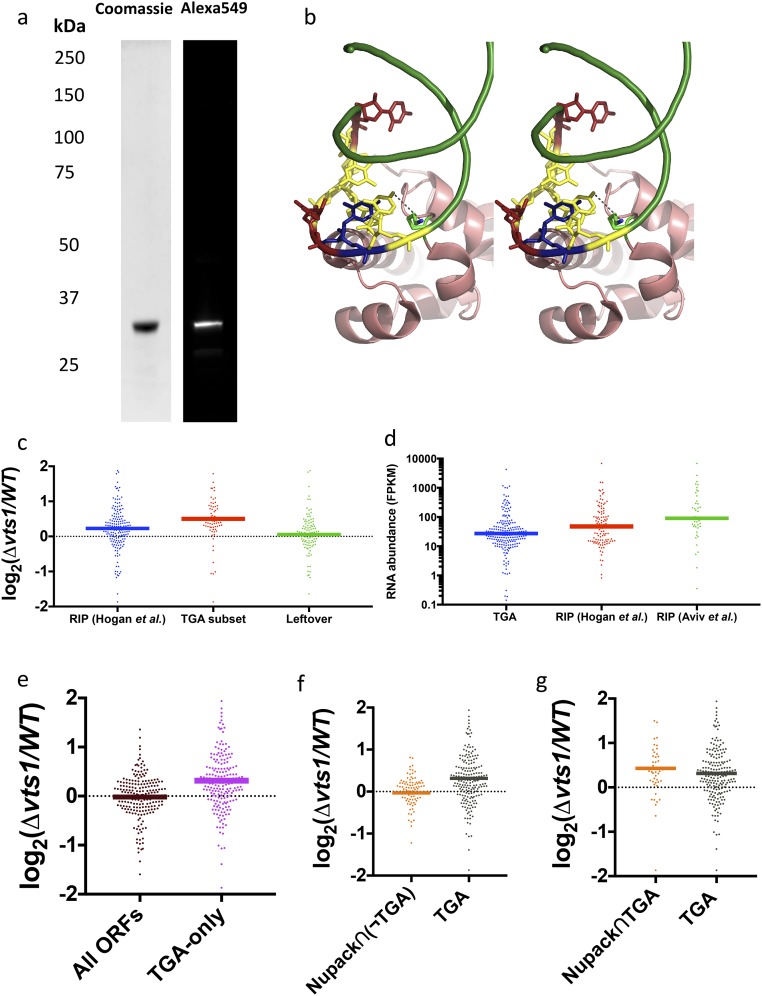
Fig. S7.
(A) Protein purification gel and SNAP-tag labeling quantification. (B) Stereoview of predicted interaction between nucleotide at position “0” and conserved lysine residue (Lys467). (C) Log2 ratio of gene expression between Δvts1 cells and WT cells. Out of all RIP-chip–defined targets, TGA picks out a subset that is much more highly expressed in Δvts1 cells than in WT cells. The remaining leftover targets show no enrichment compared with control targets. (D) RIP-chip targets are more abundant than TGA targets as measured by fragments per kilobase of transcript per million mapped reads (FPKM) in WT cells. (E) Targets unique to TGA are more highly expressed in Δvts1 cells compared with a control set of transcripts. (F) Predicted in silico targets with fold score of >5 exhibit modest overlap with TGA targets (48/296). Among nonoverlapping targets, the 92 genic targets [Nupack∩(¬TGA)] are functionally assessed by transcript levels in Δvts1 cells vs. WT cells. (G) Forty-eight shared targets between TGA and Nupack (Nupack∩TGA) assessed via transcript expression.

