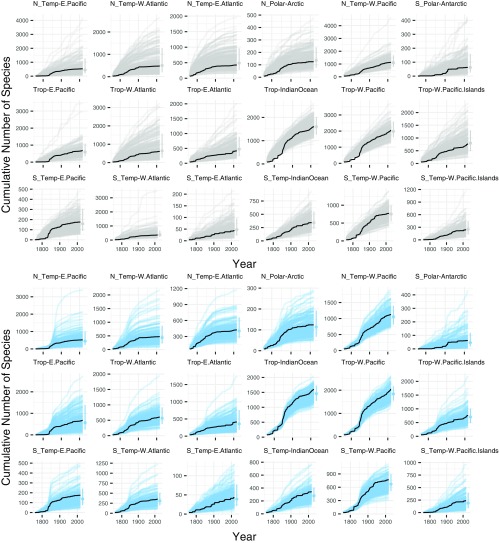
Fig. S1.
Cumulative count of described species through time per geographic region. The range of the y axis is set by region-specific counts, to better visualize model fits within regions. Lines are the same as in Fig. 2, where gray lines are model fits without TE, blue lines are fits with TE, and black lines are the observed description series. Point ranges at the end of the description series show the predicted 2016 richness with 80% credible intervals. The range of model estimates for 2016 (median estimate and 80% CI to right of each time series) bracket the observed counts across all regions for models fit with and without TE, indicating that both models successfully predict the observed count of species today.

