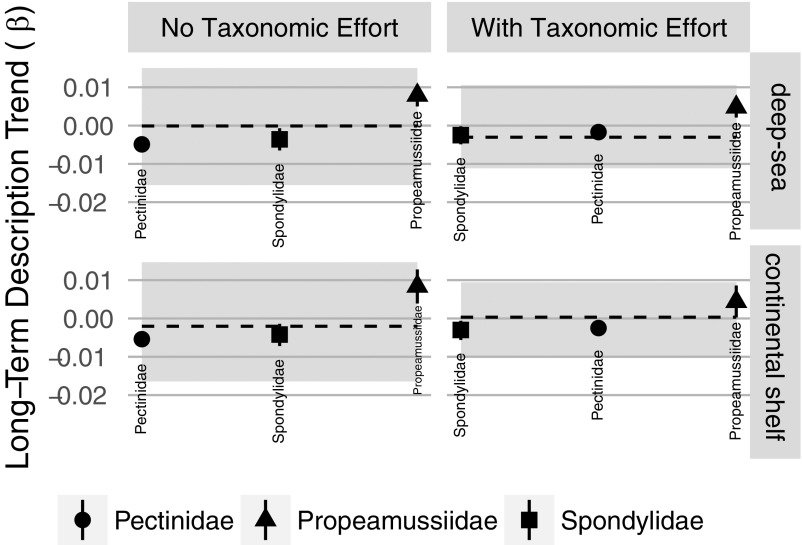
Fig. S5.
Long-term trend coefficients for species description among clades. Symbols mark the median estimate, and bar represents the 80% credible interval. The horizontal dashed black lines mark the median estimated long-term trend of description rate (80% credible interval in gray polygon). As with regions (Fig. S3), the overall rank order of long-term trend coefficients is similar between models fit with and without TE, for both the deep-sea and continental shelf datasets.

