Fig. 6.
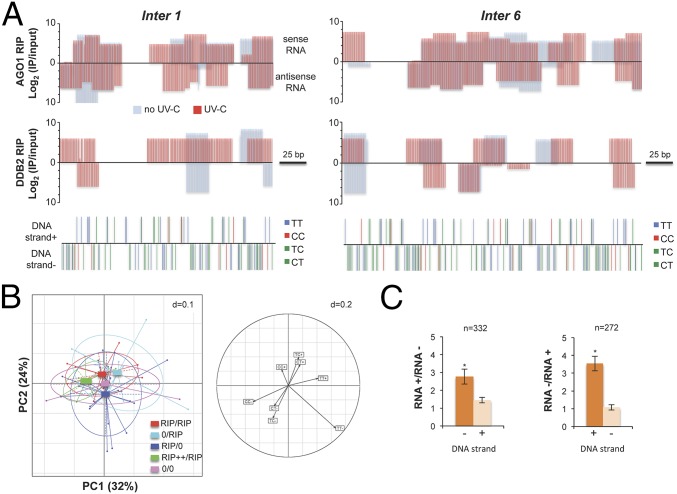
DDB2 associated 21-nt uviRNAs at damaged sites. (A) Schematic representation of AGO1 and DDB2-FLAG RIP data, showing examples of two hot spots. Log2 (IP/Input) of 21-nt ± UV-C are plotted in a RNA strand-specific manner (top bars: sense RNA; bottom bars: antisense RNA), and di-pyrimidines are plotted in a DNA strand-specific manner for each locus (top bars: DNA strand +; bottom bars: DNA strand −). (B) PCA of DDB2 RIP 21-nt uviRNAs and di-pyrimidines at six confirmed damaged loci; + and – indicate the DNA or RNA strands. (Left) Representation of DDB2 RIP data with center of gravity and lines connected to each coordinate enriched in 21-nt uviRNAs in a RNA strand-specific manner. RIP/RIP, equal enrichment of 21-nt uviRNAs mapping with each DNA strand; 0/RIP, enrichment of 21-nt uviRNAs mapping only with + DNA strand; RIP/0, enrichment of 21-nt uviRNAs mapping only with − DNA strand; RIP++/RIP, stronger enrichment of 21-nt uviRNAs mapping with − DNA strand than with the + DNA strand; 0/0, no 21-nt uviRNAs. PC1 explains 32% of the variation, and PC2 explains 24%. (Right) Circles of correlations of the PC1 and PC2 of the PCA built using di-pyrimidines (CC, TT, CT, and TC) in + and − DNA strands. (C) Fold change abundance (±SD) of sense and antisense 21-nt siRNA in CT-TC-rich DNA strands (+ and −) of Arabidopsis intergenic regions; t test *P < 0.01.

