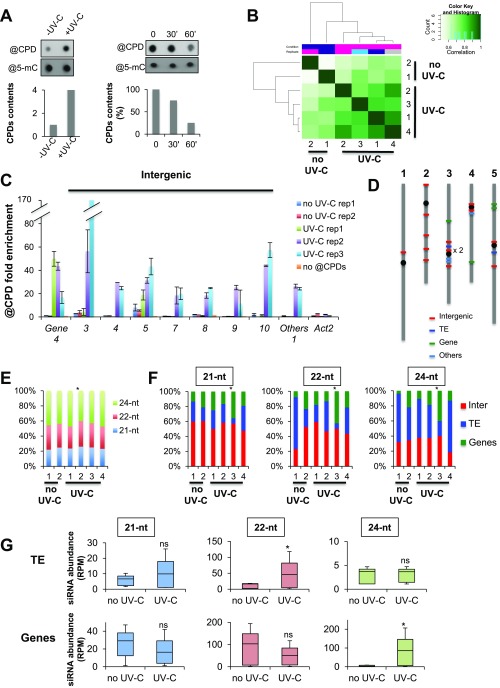
Fig. S2.
CPDs mapping and siRNAs. (A) (Left) Dot blot detecting CPDs content in untreated (−UV-C) and UV-C-treated (+UV-C) plants grown in soil (see experimental procedures for details); @5-mC were used as loading control. Histogram represents the amounts of CPDs (±SD). (Right) Dot blot detecting CPD content in a time course upon UV-C treatment; @5-mC were used as loading control. Histogram represents the amounts of CPDs (±SD) immediately after UV-C treatment (time point 0), and at 30 and 60 min upon irradiation. (B) Heat maps of CPDs enrichment all over the genome. Biological replicates are clustered. (C) Histogram representing the enrichment (IP/input ± SD) of CPDs at hot spots overlapping with intergenic regions, protein-coding genes, and other types of regions (others) using IPOUD-qPCR. Two biological replicates of untreated and three biological replicates of UV-C-treated in vitro-grown plants were used. Numbers indicate the hot spot sequence name. Actin 2 was used as negative control. (D) Schematic representation of hot spot locations on the five Arabidopsis chromosomes. (E) Repartition of 21-, 22-, and 24-nt siRNA at CPD-damaged sites. Chi2 test *P < 0.01. (F) Repartition of intergenic, TE, and genic regions enriched in CPDs overlapping with 21-, 22-, and 24-nt siRNA. Chi2 test: *P < 0.01 compared with untreated plants. (G) Box plots representing the abundance of 21-, 22-, and 24-nt siRNAs mapping to TE and genic regions enriched in CPDs. Mann−Whitney U test *P < 0.05; ns, nonsignificant.

