Fig. S4.
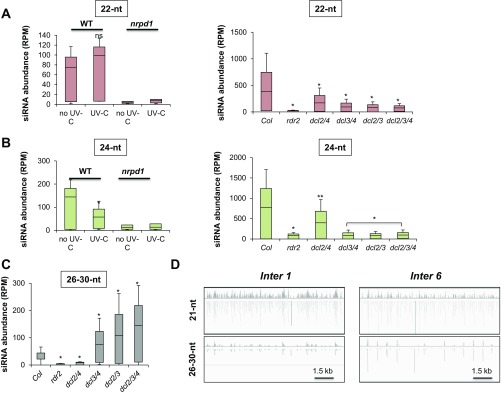
The siRNA biogenesis. (A) Box plots representing the abundance of 22-nt siRNA at intergenic CPD-damaged regions in WT plants and in RNA POL IV-deficient plants (nrpd1) ± UV-C and in WT plants (Col), rdr2, dcl2/4, dcl3/4, dcl2/3, and dcl2/3/4 plants. *P < 0.01 calculated according to Wilcoxon matched-pairs signed rank test. (B) Same as A for 24-nt siRNA. (C) Box plots representing the abundance of 26- to 30-nt siRNAs at intergenic CPD-damaged regions in WT plants (Col) and in rdr2, dcl2/4, dcl3/4, dcl2/3, and dcl2/3/4 plants. *P < 0.01 calculated according to Wilcoxon matched-pairs signed rank test. (D) Browser view of (Top) 21-nt siRNA and (Bottom) 26- to 30-nt RNA abundances at two intergenic hot spots loci.

