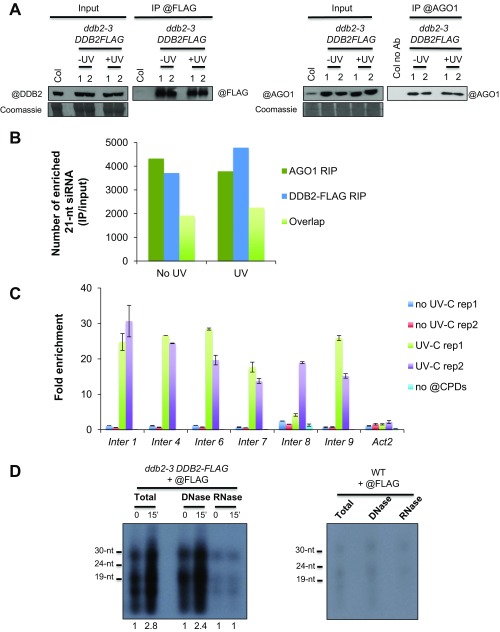
Fig. S6.
DDB2 and AGO1 RIP. (A) In vivo pull-down of AGO1 and DDB2-FLAG protein upon UV-C exposure during the RIP experiments; ddb2-3/DDB2-FLAG expressing plants were used with (Top) anti-FLAG or (Bottom) anti-AGO1 antibodies. WT plants were used as negative control. Coomassie blue staining of the blot is shown. The two independent biological replicates are shown. (B) Histograms representing the number of intergenic sequences exhibiting enrichment (IP/input) of 21-nt siRNAs in DDB2 RIP and AGO1 RIP ± UV-C. The number of overlapping sequences between DDB2 and AGO1 RIP are also shown. (C) Histograms (±SD) representing the enrichment (IP/input) of CPDs at six hot spots during the RIP experiments. (D) DDB2-FLAG coprecipitated nucleic acids from UV-C untreated and treated plants. (Left) The ddb2-3/DDB2-FLAG expressing plants were used with anti-FLAG antibody. Nucleic acids were isolated, 32P-radioactively labeled and treated with either A or DNase I (5 h incubation). Samples were fractionated onto a 15% urea PAGE. (Right) Untreated WT plants were used as control for IP with anti-FLAG antibody. Signal intensity relative to each time point 0 is indicated below each lane.

