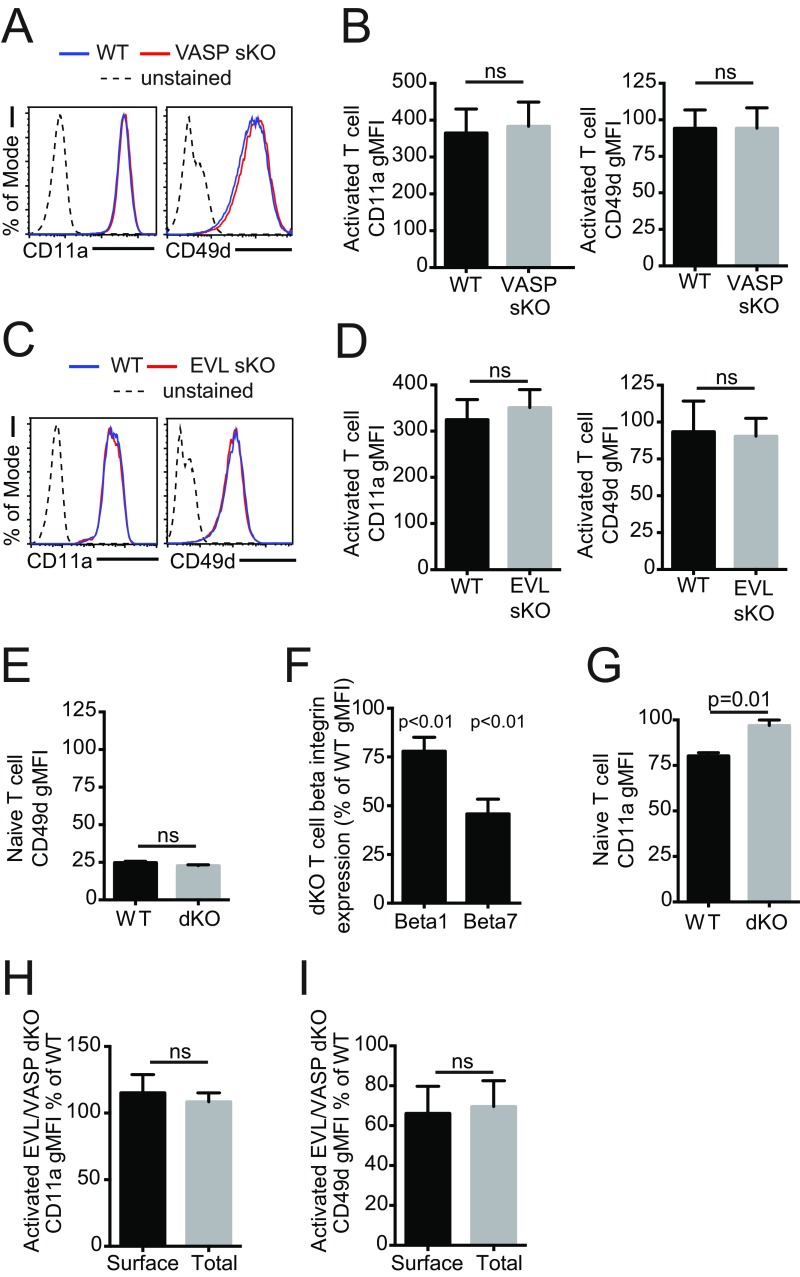
Fig. S6.
Integrin expression profiles on activated and naïve EVL and VASP KO T cells. (A) Examples of CD11a and CD49d expression by flow cytometry in activated VASP sKO T cells. (B) Quantification of CD11a and CD49d expression in activated VASP sKO T cells. (C) Examples of CD11a and CD49d expression by flow cytometry in activated EVL sKO T cells. (D) Quantification of CD11a and CD49d expression in activated EVL sKO T cells. (E) Quantification of expression of CD49d in naïve WT and EVL/VASP dKO T cells by flow cytometry. (F) Quantification of CD29 (β1 integrin) and β7 integrin expression in activated WT and EVL/VASP dKO T cells, shown as the percentage of expression in dKO T cells relative to WT T cells by gMFI. (G) Quantification of CD11a expression in naïve WT and EVL/VASP dKO T cells by flow cytometry. (H) Surface expression and total expression (measured by staining after permeabilization) of CD11a in activated T cells, shown as the percentage of expression in dKO relative to WT T cells by gMFI. (I) Surface expression and total expression (measured by staining after permeabilization) of CD49d in activated T cells, shown as the percentage of expression in dKO T cells relative to WT T cells by gMFI. Data in A and C are representative of three independent experiments; data in B and D–I are the mean of at least three independent experiments. Error bars are SEM; statistics are paired t tests except in F, which are one-sample t test compared with a hypothetical value of 100. ns, not significant.

