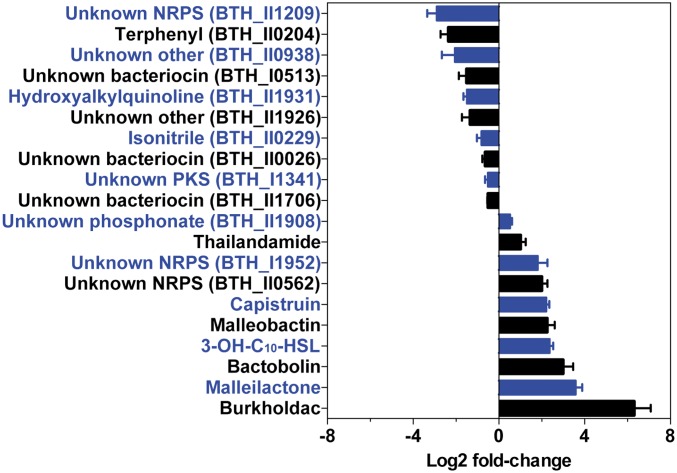
Fig. 5.
Regulation of secondary metabolism by scmR. Shown is the effect of scmR deletion on the expression of 20 secondary metabolite BGCs as determined by RNA-seq analysis. Within a BGC, the changes in expression level for each gene were averaged to give the overall fold change for the cluster, as a result of scmR deletion (see also SI Appendix, Table S6). Error bars represent SEM. The bars and corresponding labels are alternately colored for clarity.

