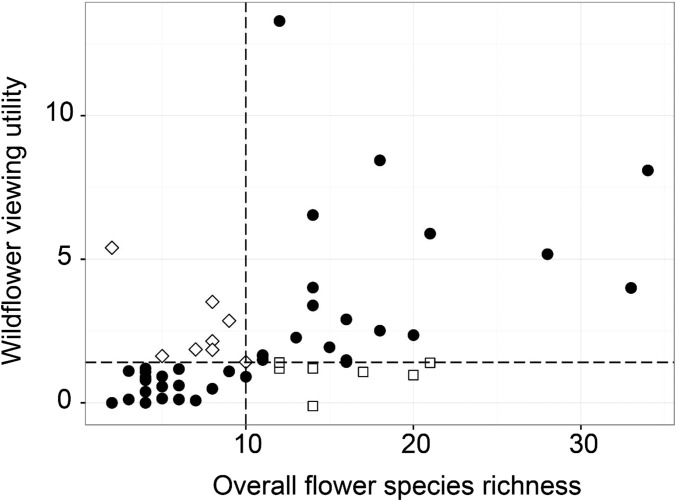
Fig. 2.
Predicted wildflower viewing utility correlated with overall flower species richness of 54 wildflower communities in the southern Appalachian Mountains. Dashed lines show the hotspot classification thresholds (median values) for each indicator. Sites were either not hotspots (below the median, bottom left quadrant), agreed-upon hotspots (above the median, top right), or hotspots based on either wildflower viewing utility (top left) or species richness (bottom right) but not the other. Closed circles indicate agreement, and open symbols indicate disagreement in hotspot classification. Wildflower community data were collected over an 18-wk period between April and August 2014 (see ref. 48 for details); discrete-choice data used to predict wildflower viewing utility were collected in 2015.

