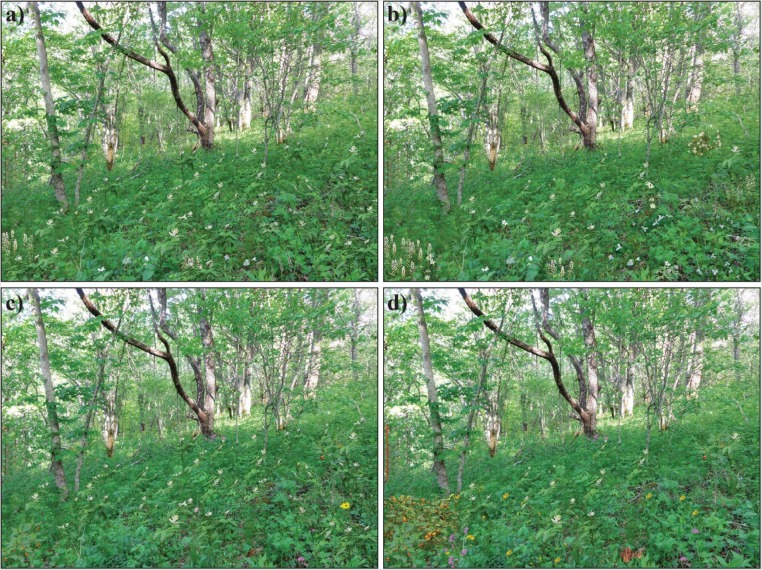
Fig. S2.
Four example images showing differences in wildflower community. Images vary only in the number of colors and evenness, with species richness and flower abundance held constant at five species and ninety flowers, respectively. Image A shows one color and low evenness, B one color and high evenness, C five colors and low evenness, and D five colors and high evenness. Based on the results of the discrete-choice experiment, D would have the highest predicted wildflower viewing utility.

