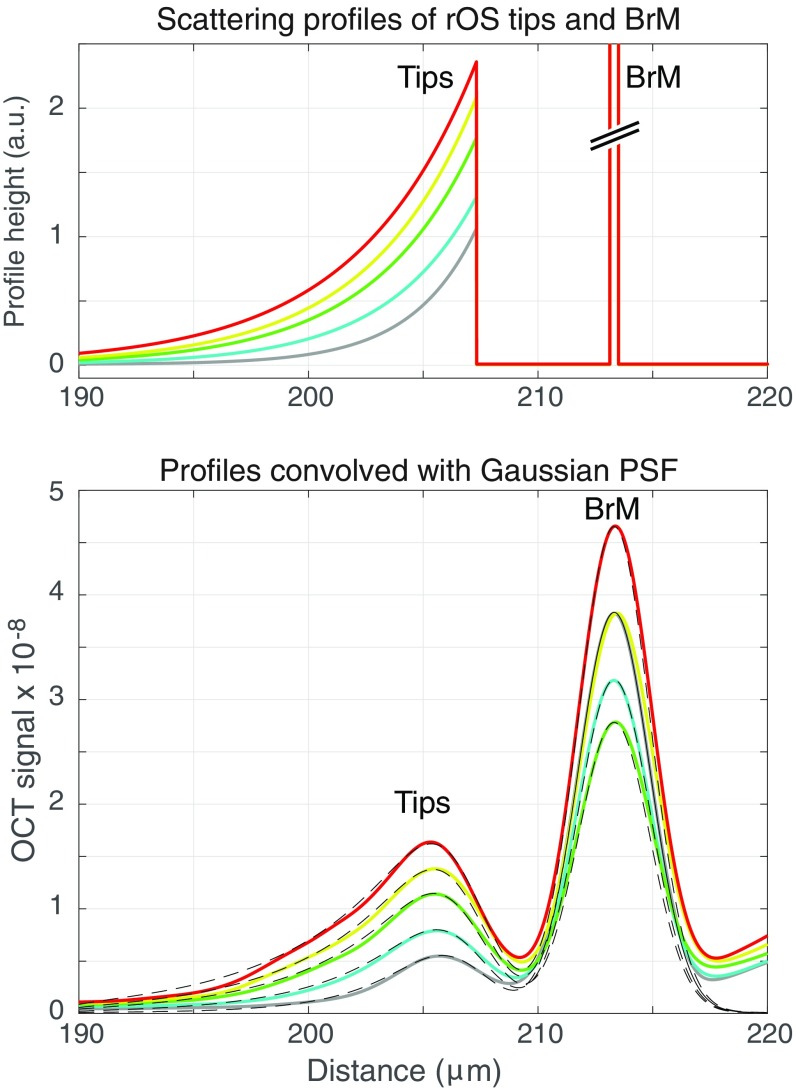
Fig. S2.
Effect of limited OCT axial resolution and increased backscattering on the apparent position of the distal tips of the rod OS in the profile plots of Fig. 1D, Inset. (Upper) Hypothetical scattering profiles of the rod OS tips and BrM. The rod OS profiles are represented by exponential functions with maxima at the tips and decay toward the middle of the OS; the space constants vary from 2.8 μm (gray curve) to 5.2 μm (red curve). The width of the BrM profiles was fixed at 0.35 μm based on mouse retinal EM data (101); the BrM amplitudes ranged from 80 to 133 and cannot readily be displayed on a common ordinate scale. (Lower ) The colored traces are replotted from Fig. 1D, Inset. The dashed black lines plot the corresponding backscattering profiles from the Upper panel convolved with a Gaussian having a FWHM of 1.83 μm, the equivalent axial psf of the OCT system. The predicted profiles closely match the BrM and tips peaks, including the shifts of the latter toward the vitreous.

