Fig. 4.
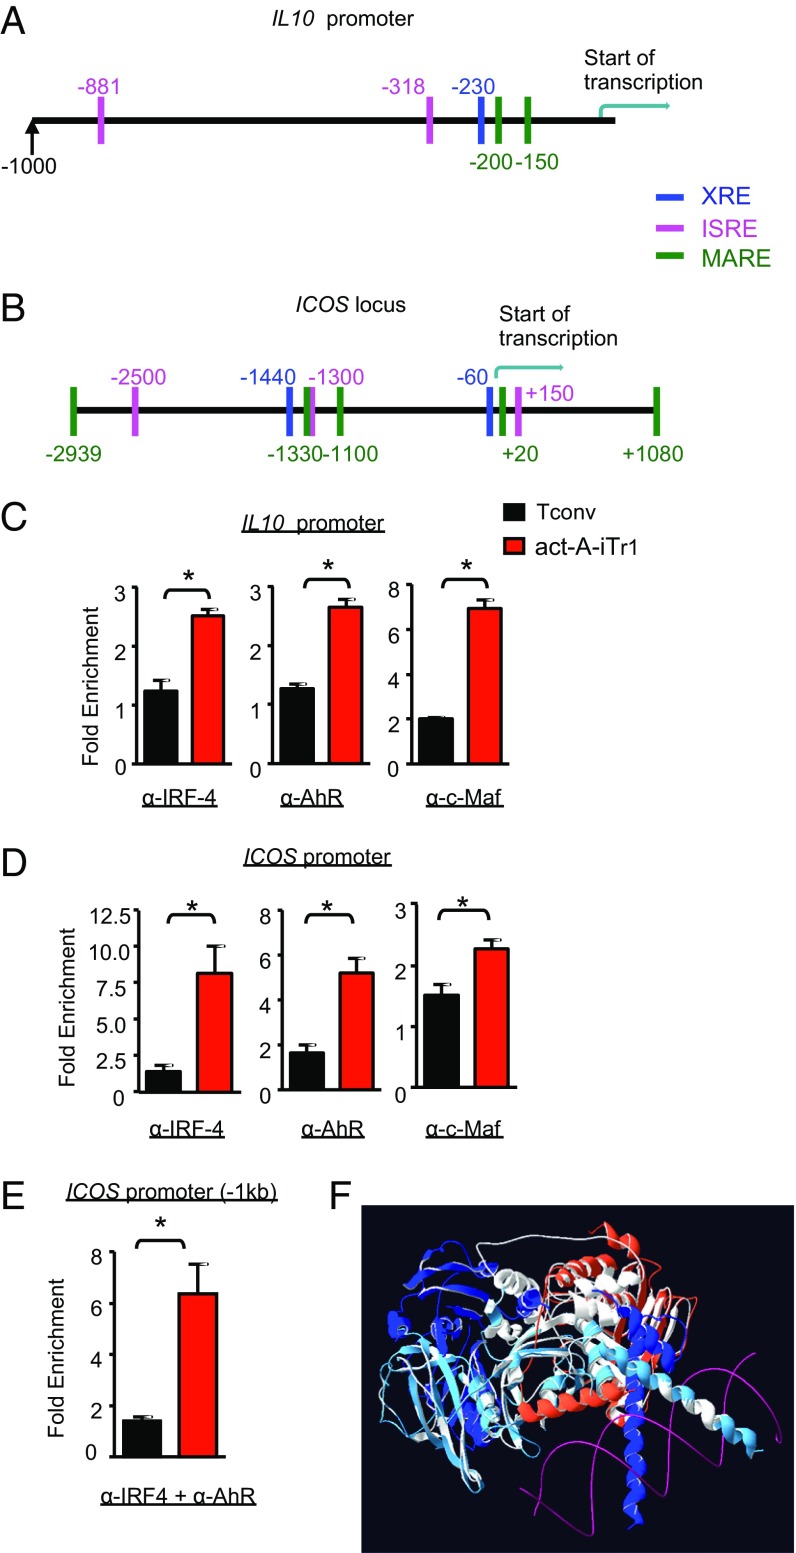
IRF4 assembles into a complex with AhR in the ICOS promoter in human act-A–iTr1 cells. Schematic representation of the human IL10 promoter (A) and ICOS locus (B); the c-Maf, AhR, and IRF4 putative binding sites are shown. Positions are given in base pairs relative to the transcription start site. (C and D) Tconv or act-A–iTr1 cells were generated following stimulation with anti-CD3/CD28 antibodies in the presence of PBS or activin-A, respectively. ChIP analysis of IRF4, AhR, and c-Maf binding in the IL10 (C) and ICOS (D) promoters is shown. Data are presented as ± SEM and are pooled from two independent experiments (n = 4 donors, two donors per experiment). (E) Tconv or act-A–iTr1 cells were generated as in C. Sequential ChIP analysis demonstrates IRF4 and AhR cobinding in the ICOS promoter. Data are presented as mean ± SEM and are pooled from two independent experiments (n = 4 donors, two per experiment). (F) Computational model of the putative protein–protein interactions of IRF4 and AHR is shown in white superimposed with the solved structures used for the homology modeling (PDB ID codes 3DSH and 4ZPR). The template chain of the IRF4 model is shown in orange. In the 4ZPR structure, the ARNT chain is shown in blue, the AHR template chain is shown in light blue, and the DNA is shown in magenta. Statistical analysis was performed by a nonparametric (Mann–Whitney) unpaired Student’s t test (*P < 0.05).

