Fig. 5.
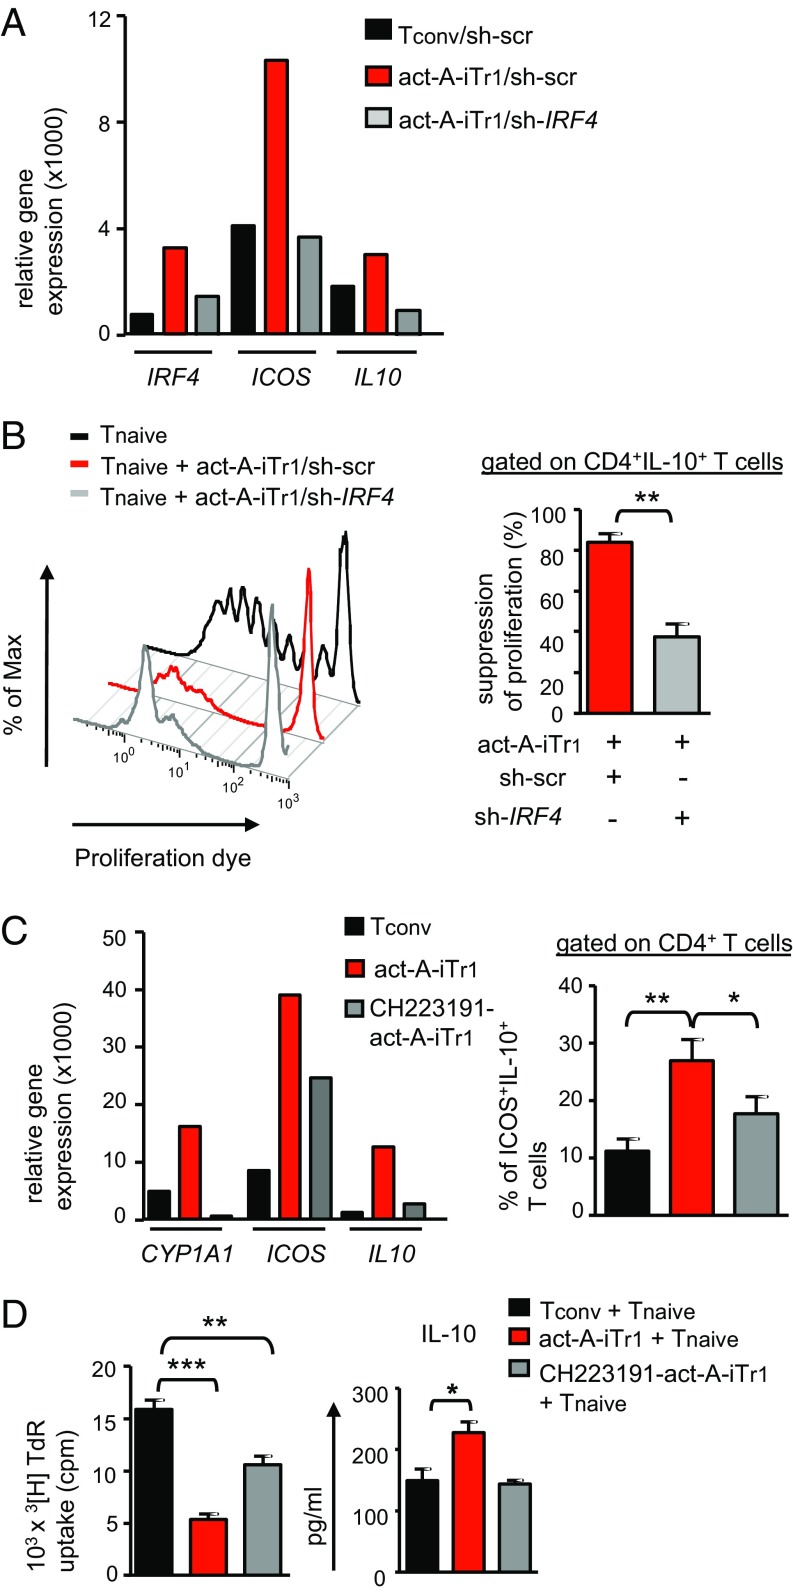
IRF4 and AhR drive activin-A–induced human Tr1 cell differentiation. (A) Tconv or act-A–iTr1 cells were stimulated with APCs and allergen, and transduced with shRNA against human IRF4 (sh-IRF4) or a scrambled nontargeting control RNA sequence (sh-scr). Real-time PCR analysis is shown. Data are relative to GAPDH and represent n = 3 independent experiments (n = 3 donors). (B) Transduced act-A–iTr1 cells were cocultured with naive Cell Trace Violet-labeled CD4+ T cells and allergen-loaded APCs. Representative FACS plots of T-responder cell proliferation are shown. Cumulative data, shown as mean ± SEM, depict suppression of proliferation (%) and are pooled from n = 4 separate experiments (n = 4 donors). (C) Tconv or act-A–iTr1 cells were generated following stimulation with allergen-loaded APCs in the presence or absence of the AhR antagonist CH223191. (Left) Real-time PCR analysis is shown. Results are relative to GAPDH and represent n = 4 separate experiments (n = 4 donors). (Right) Cumulative data showing the percentages of CD4+ICOS+IL-10+ T cells summarize four independent experiments (n = 4 donors). (D) Tconv or act-A–iTr1 cells, generated as in C, were isolated and cocultured with CD4+ T cells and allergen-loaded APCs. 3[H]Thymidine incorporation and IL-10 release are shown. Data are mean± SEM of triplicate wells and are pooled from n = 4 independent experiments (n = 2 donors). Statistical significance was obtained by the Student's t test (*P < 0.05; **P < 0.01; ***P < 0.001).

