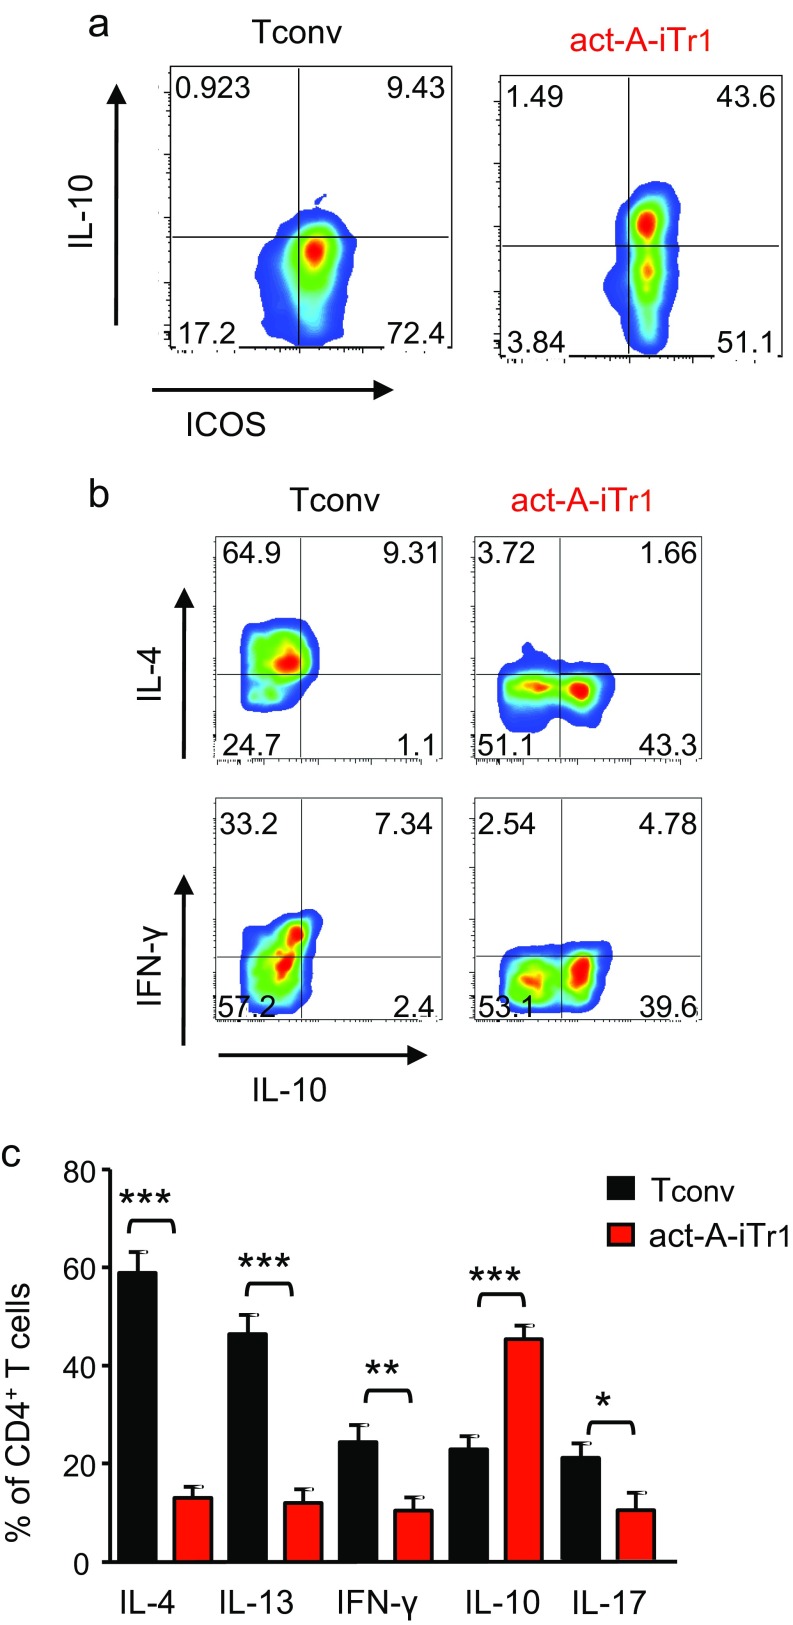
Fig. S8.
Act-A–iTr1 cells retain their phenotype following prolonged stimulation in vitro. Human Tconv or act-A–iTr1 cells were restimulated (once per week) with allergen-loaded APCs and IL-2 for 4 wk. Representative FACS plots show ICOS and IL-10 expression gated on CD4+ T cells (A) and intracellular cytokine expression (B). Data represent n = 5–6 separate experiments (n = 6 donors). (C) Cumulative data showing the percentages of cytokine-producing CD4+ T cells. Data shown are mean ± SEM and are pooled from n = 5–6 independent experiments (n = 6 donors). Statistical analysis was performed by the Student’s t test (*P < 0.05; **P < 0.01; ***P < 0.001).

