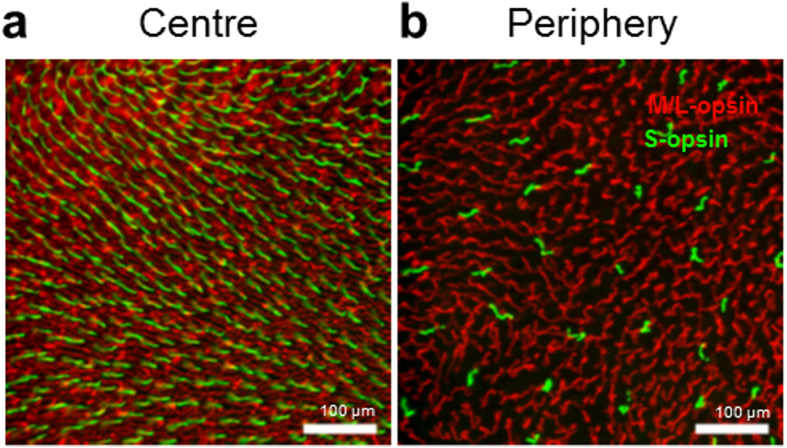
Figure 1. An example of changes in cone density across the temporal retina.
The spatial distribution of cones stained for M/L-opsin (red) and S-opsin (green) from a young animal. (a) Was taken in the temporal parafovea (1.3 mm eccentricity). (b) Was taken in the temporal periphery (10 mm eccentricity). There was a clear gradient in cone density across this axis, but no obvious differences in cone density between young and old animals.

