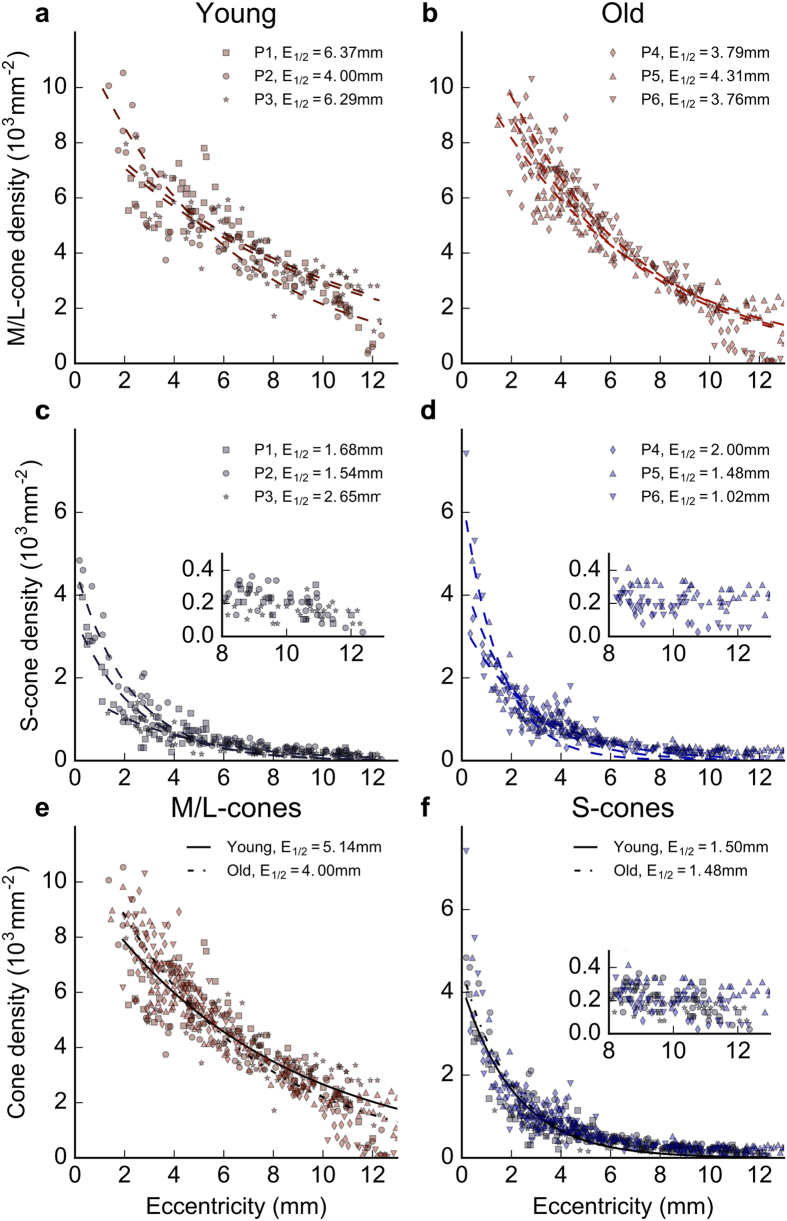
Figure 2. Cone density and eccentricity in young and old animals.
Densities of M/L- and S-cones in young and old macaques extending from the central retina to 13 mm temporal periphery. (a) The densities of M-/L-cones in 3 young (6 years old) animals. (b) Corresponding data for 3 old (17 years old) macaques. Data are not provided for the central most location as cell density was too great for reliable counting. (c) Counts of S-cones over exactly the same region in 3 young animals. (d) Counts of S-cones over the same region in 3 old primates. In each case patterns are very similar for the two age groups. (e) and (f) Density of the two age groups are overlaid, for L-/M-cones and S-cones, respectively. (e) Densities for M-/L-cones in young and old primates with regression lines for the two populations. Data sets for the two ages match closely except in the far periphery. (f) Densities for S-cones in young and old primates with regression lines for the two populations. Again these match closely. Taken together the data in the 6 graphs show that there is no difference between young and old primates in terms of cone densities. Because of the low S- cone density in the periphery, their densities have been represented twice at different scales in the regions beyond 7 mm eccentric. The first is on the same scale as other counts (Fig. 2a and b) and the second is on an expanded Y axis to provide a clearer picture of their distribution.

