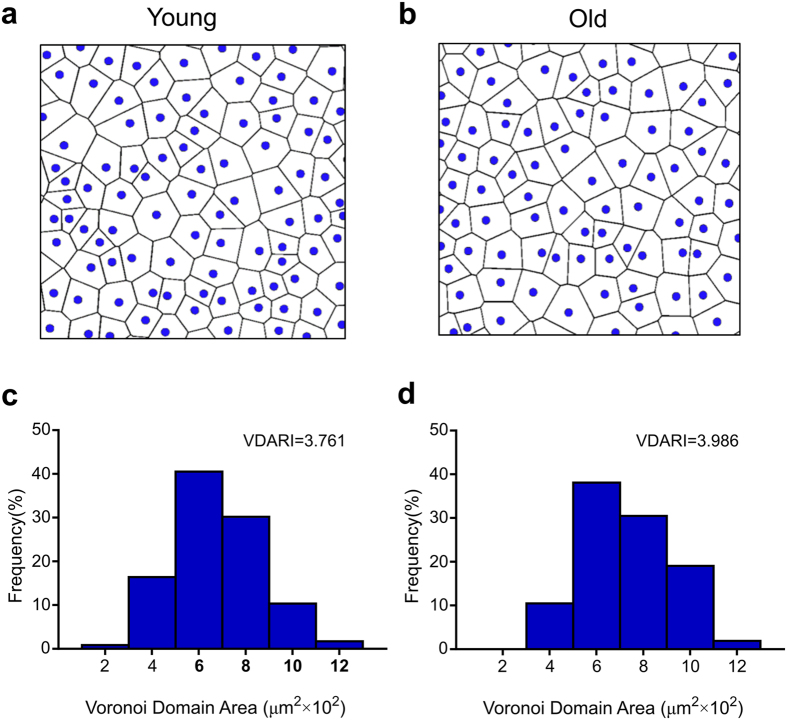
Figure 3. Voronoi domain analysis provides both diagrams and metrics of mosaic regularity.
(a) and (b). Voronoi diagrams of S-cones in 200 × 200 μm regions of young (a) and old (b) retinae, at 1.07 mm and 1.17 mm eccentricity respectively. For each S-cone, a polygonal domain was created by identifying pixels that are closer to it than any other S-cone. The two diagrams are qualitatively similar. (c) and (d). Frequency distributions of Voronoi domain area, for the diagrams shown in A and B, respectively. The distributions are similar, echoed by the small difference between the Voronoi domain area regularity indices (VDARI), which is the area mean divided by the area standard deviation, for each sample. Together, these data show that S-cone regularity is not impacted by age, which implies no age-related loss in S-cones since such loss would result in a loss of regularity.

