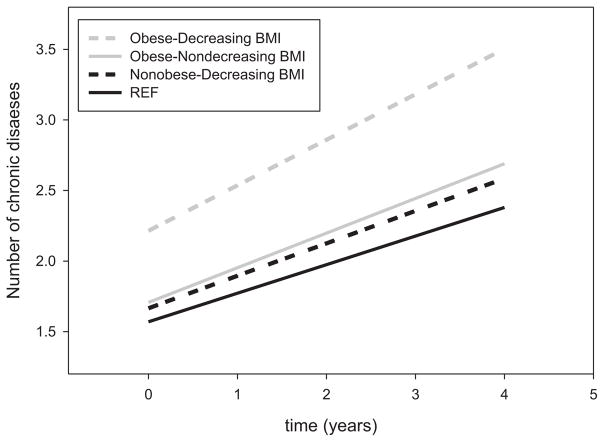
Figure 2.
Mixed models were used to estimate trajectories of multimorbidity over time (average follow-up, 4 years) according to four groups based on the presence and absence of baseline obesity and decreasing or not decreasing body mass index (BMI) over time (not obese–not decreasing BMI (reference, solid dark line), n = 494; not obese–decreasing BMI (dashed dark line), n = 103; obese–not decreasing BMI (solid gray line), n = 149; obese–decreasing BMI (dashed gray line), n = 50).

