
Figure 3.
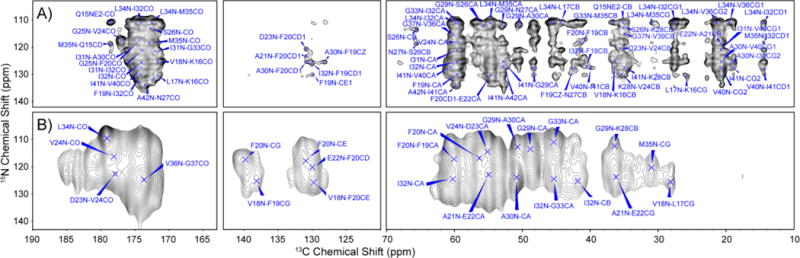
(A) 2D 13C−15N MAS PAIN spectrum of U−13C/15N-AβM01–42 fibrils recorded at ω0H/2π = 750 MHz, T = 277 K, ωr/2π = 20 kHz, τmix = 30 ms, with ω1H/2π = 83 kHz 1H decoupling field. Particularly relevant intramolecular contacts include F20–G25, G29–I41, V24–A30, and I31–V36, and intermolecular contacts include V18–L34 and L17–L34. (B) 2D 13C−15N ZF-TEDOR (τmix = 16 ms) spectrum of 2−13C1-glycerol/15N mixed sample recorded at 600 MHz, ωr/2π = 12.5 kHz, VT gas regulated to 105 K with 83 kHz TPPM during acquisition. The cross-peaks observed in this spectrum confirm that the fibrils are PIR. A total of 24 cross-peaks are observed, with the most relevant cross-peaks observed being I32N–I32CA, F20N–F20CA, G29N–G29CA, G33N–G33CA, L34N–L34CO, V24N–V24CO, and V36N–G37CO.