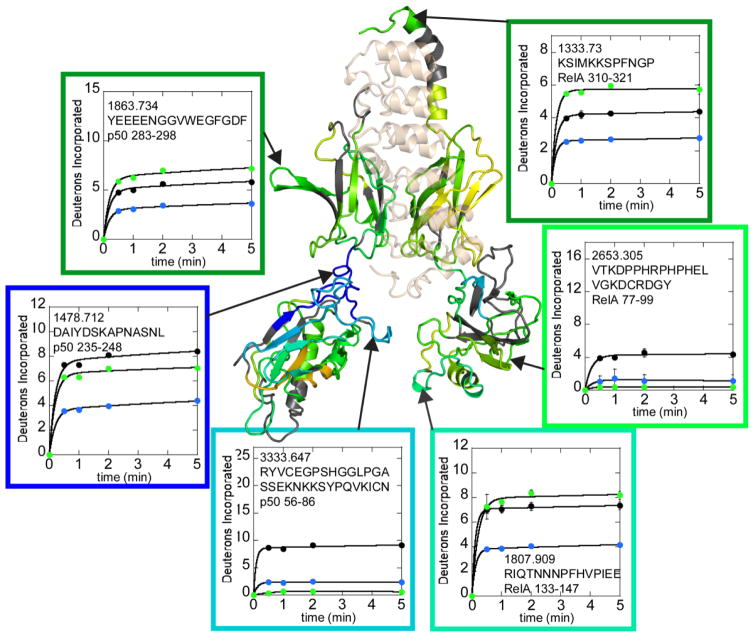
Figure 5.
Selected HDXMS uptake plots of free NFκB (black circles) vs. IκBα-bound NFκB (green circles) or IκBα-bound NFκB (blue circles) showing some of the regions within NFκB that exchange less when IκBα is bound. The IκBα-bound NFκB (RelA-p50) structure and boxes around each plot are colored according to the same rainbow scale with the same upper and lower bounds as that used in Figure 4. The deuterium uptake plots are positioned near the corresponding structural regions and are also marked by arrows.

