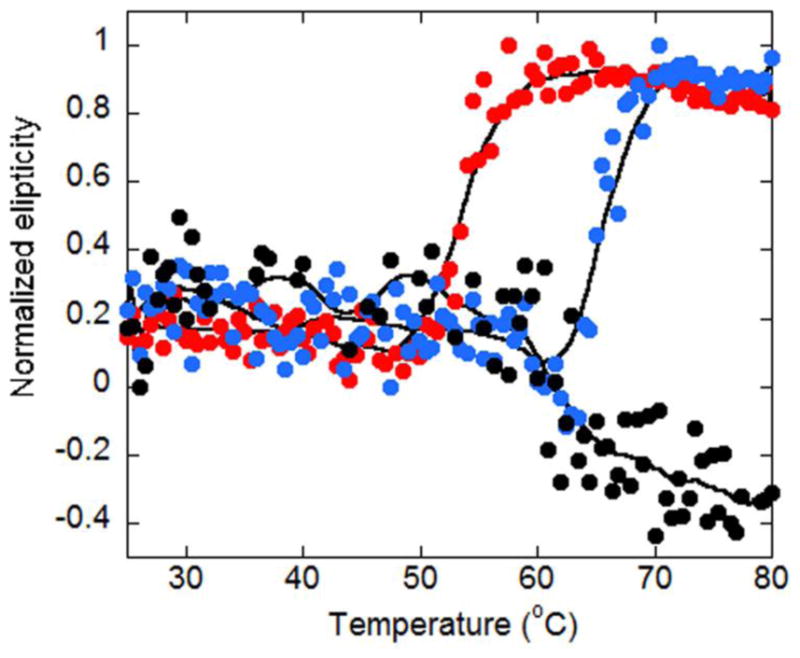
Figure 6.

Thermal melting curves were determined by circular dichroism monitoring the signal at 225 nm for NFκB alone (red circles), DNA-bound NFκB (blue circles) or IκBα-bound NFκB (black circles). The normalized CD signal at 225 is plotted against increasing temperature. The thermal denaturation of NFκB, IκBα, and their complexes is irreversible.
