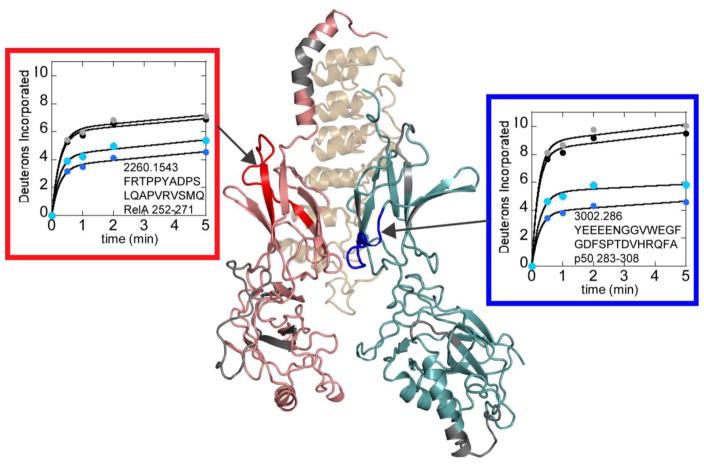
Figure 7.
Comparison of the deuterium uptake into full-length NFκB in complex with IκBα (blue) vs. the deuterium uptake into the DNA-binding domain deletion NFκB construct in complex with IκBα (cyan) revealed regions within the dimerization domain subdomains that had increased deuterium uptake in the deletion construct. These same regions did not show differences in free NFκB (full-length, black; DNA-binding domain deletion construct, grey). The difference in uptake was observed in different dimerization domain subdomain structural regions in RelA (red) vs. p50 (blue). The structural model is shown rotated 180° about the y axis compared to that shown in Figures 3 and 5 to more easily view the regions of interest.

