
Figure 2.
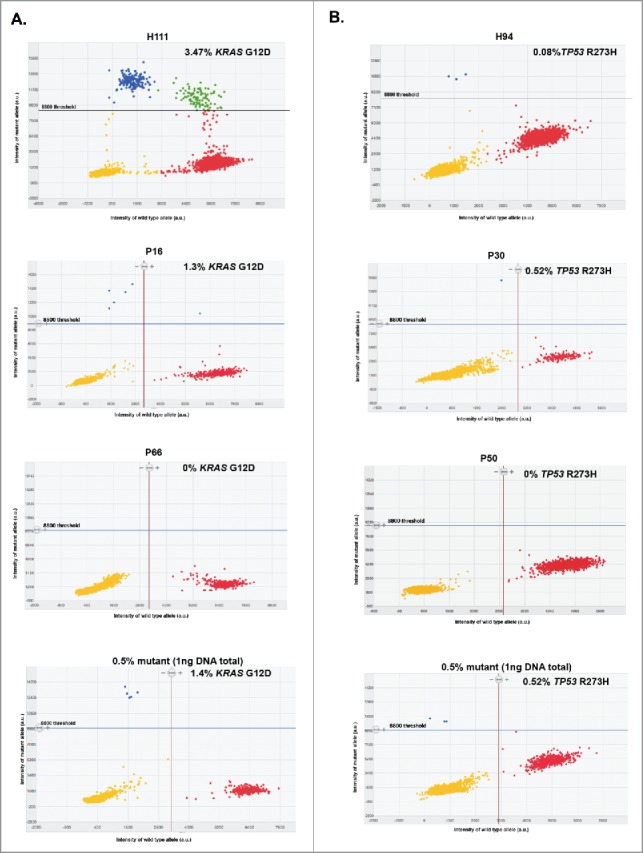
Representative 2D intensity scatter plot of wild-type and mutant amplicon for KRASG12D (A) KRASG12D and (B) TP53R273H, PDAC patients (P16, P50), an IPMN patient (P30) and a CP patient (P66), and control spiked-in reactions (0.5% mutant). Threshold for mutant was set to 8800. Yellow, no DNA; blue, mutant; red, wild-type; green, mutant and wild-type, ng: nanograms.