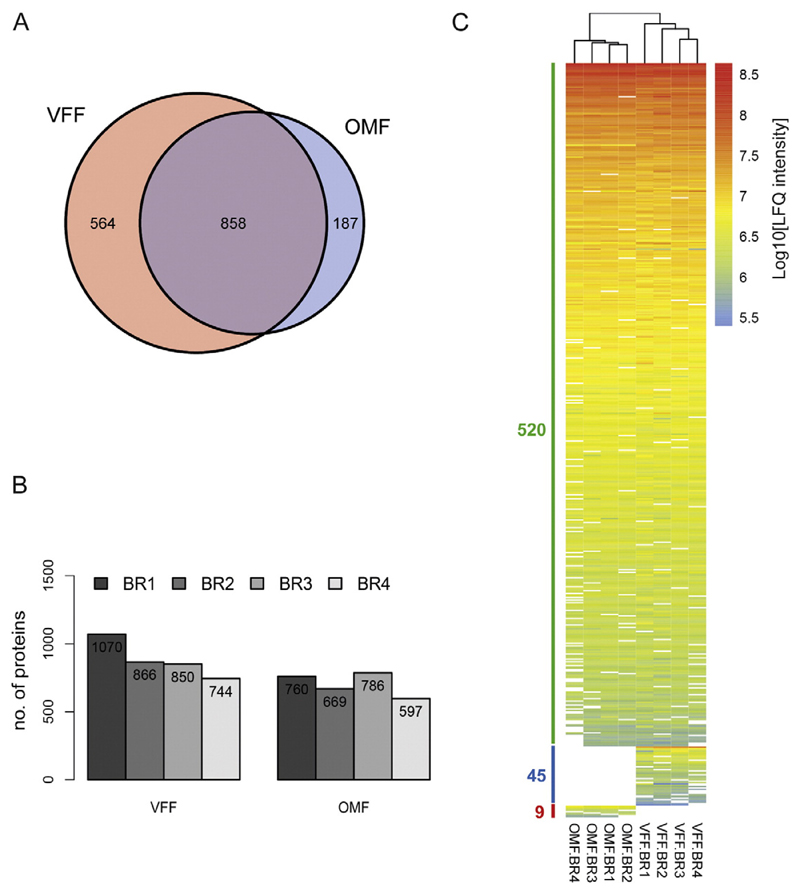
Fig. 3.
Proteomic profiling of paired vocal fold fibroblasts (VFF) and oral mucosa fibroblasts (OMF). (A) Venn diagram depicting the number of proteins detected solely in VFF, solely in OMF, and in both cell types. (B) Number of robustly detected proteins (≥2 peptide counts (razor + unique)) for each biological replicate (BR1–BR4). (C) Heat map showing log10-transformed normalized LFQ intensity values for three groups: group 1, 520 proteins detected in both cell types; group 2, 45 proteins detected only in VFF, group 3, 9 proteins detected only in OMF. Within each group, proteins are sorted in a decreasing manner according to their mean abundance. Clustering tree resulting from unsupervised clustering of samples is shown on top.

