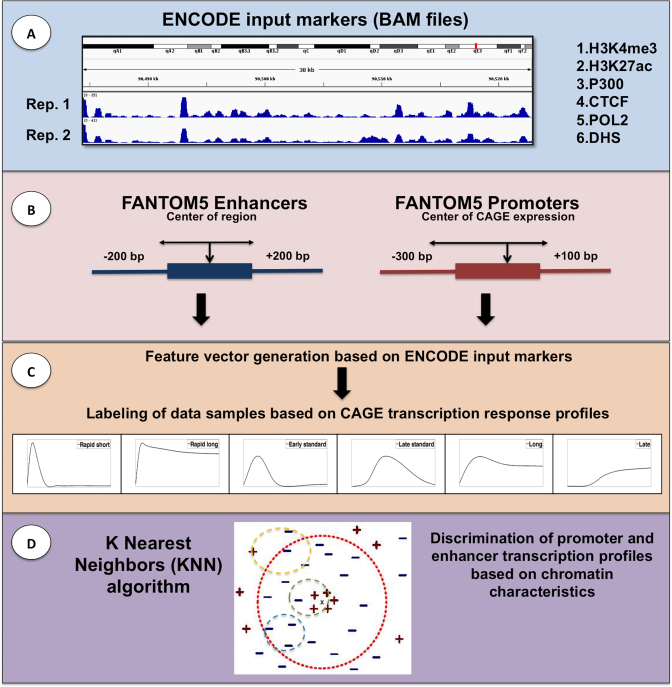
Figure 1.
Schematic diagram of PEDAL. (A) The first panel shows the data integration and the combination of different replicates for all markers. (B) The second panel shows the preparation of promoter and enhancer regions we use for finding overlaps with input BAM reads. (C) The third panel shows the feature vector generation process and the labeling based on different CAGE expression profiles from (12). (D) The last panel shows an example of discriminating response subclasses using KNN.

