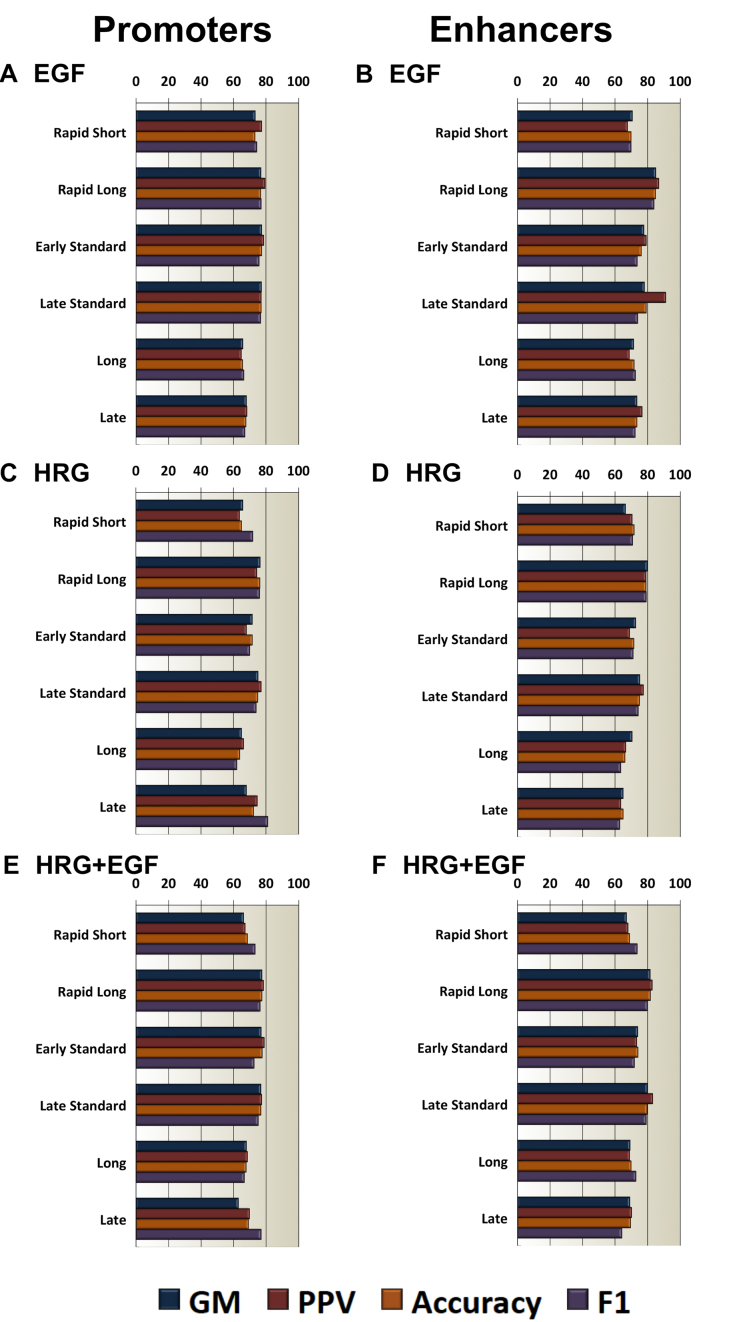
Figure 3.
PEDAL's classification performance for distinguishing promoter and enhancer subclasses using optimized combinations of input markers. All left panels correspond to promoters and all right panels correspond to enhancers: (A and B) correspond to PEDAL models specific to EGF stimulation; (C and D) correspond to PEDAL models specific to HRG stimulation; (E and (F) correspond to the non-stimulation specific PEDAL models trained, validated and tested on all the available EGF and HRG data.

