Figure 2.
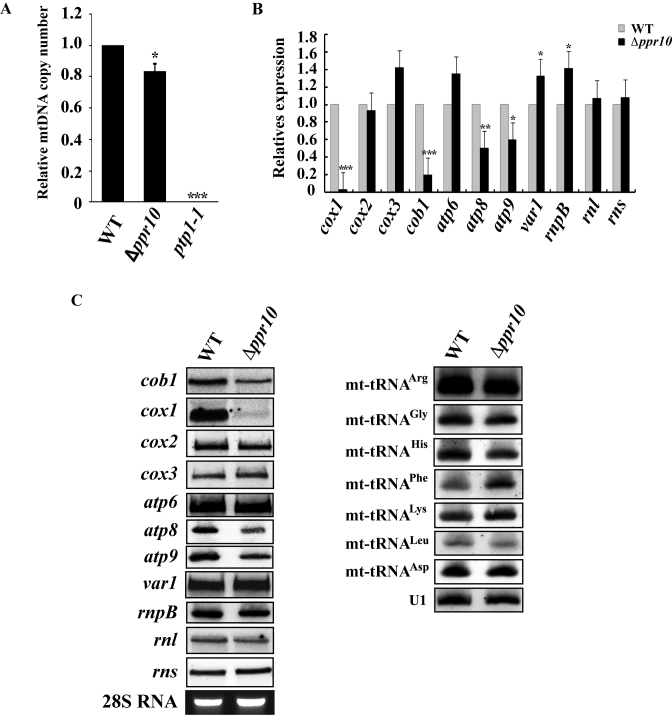
Analysis of mtDNA copy number and steady-state levels of mature mitochondrial-encoded RNAs (mt-RNAs) in wild-type (WT) and Δppr10 cells. (A) mtDNA copy numbers in WT and Δppr10 cells were measured by qPCR and expressed as mtDNA/nuclear DNA ratio. The fold change in mtDNA copy number of Δppr10 cells compared to that of WT cells (whose value was set to 1) is shown. See Materials and Methods for details on the calculation. The error bars represent the S.D. of triplicates. Statistically significance was determined by the Student's t-test (∗P < 0.05, ∗∗∗P < 0.001). As a control, mtDNA copy number in mtDNA-less ptp1-1 cells was also measured. (B) qRT-PCR analysis of the steady-state levels of mature mt-RNAs in WT and Δppr10 cells. Levels of mature mt-RNAs in Δppr10 cells are normalized to the level of htb1 mRNA and expressed as fold change over control WT strain yHL6381 (set to 1). Statistically significance was determined by the Student's t-test (∗P < 0.05, ∗∗P < 0.01, ∗∗∗P < 0.001). (C) Northern blot analysis of mature mt-RNAs from WT or Δppr10 cells. Total RNAs were purified from WT or Δppr10 cells, separated on a formaldehyde agarose gel or a denaturing polyacrylamide gel (7 M uera), transferred to a nylon membrane. The blots were hybridized with 32P-labeled probes that specific for mt-RNAs as indicated. U1 snRNA detected by northern blotting and ethidium bromide-stained 28S rRNA were used as loading controls.

