
Figure 2.
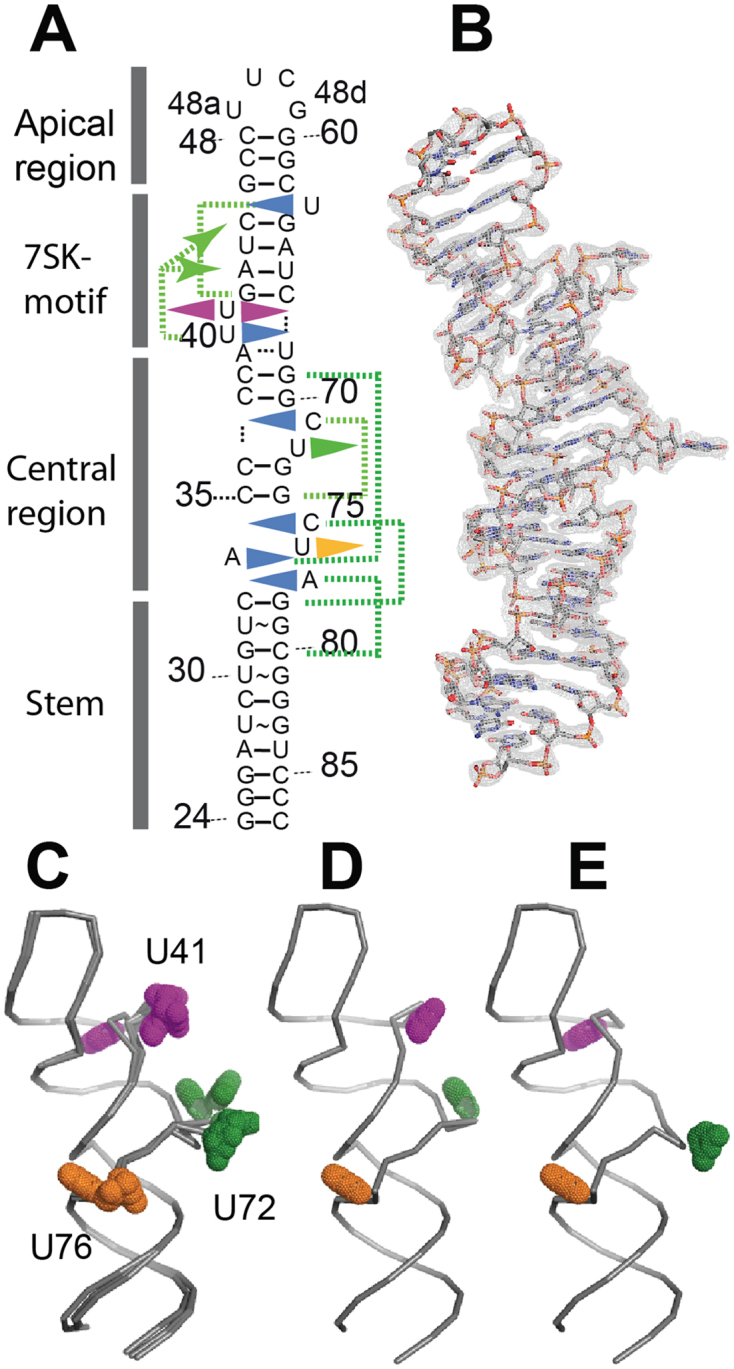
Global view of the molecule highlighting the conformation variability. (A) Sequence of HP1 showing the four regions and highlighting the bulged nucleotides (triangles) forming triple interactions in the helical stack (blue triangle turned inwards) or facing the solvent (triangle outwards) with U41 (magenta), U72 (green) and U76 (orange). Green dotted lines connect the bulged residues with their coplanar base-pairs. (B) Molecule B (grey sticks) in the Au-map contoured at 1.0 σ. (C) Superposition of several molecules (molecule A from Au-, Os- and native maps) showing position variation at U72 or U41. (D) Conformation OUT, as observed in molecule A of Au-map. (E) Conformation IN, as observed in molecule A of Au-map.