Figure 3.
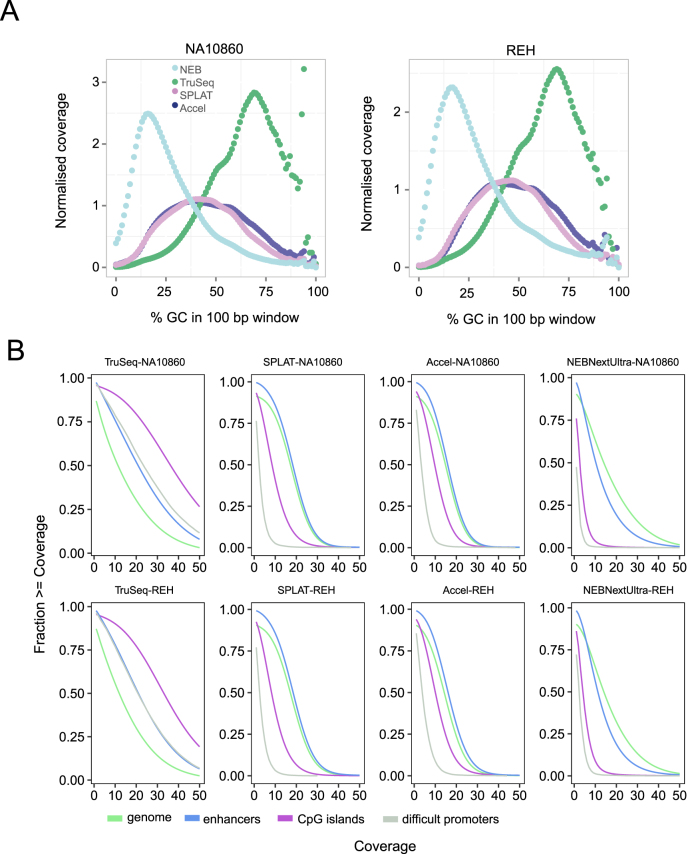
Sequence bias in whole genome bisulphite sequencing libraries. (A) GC bias observed for the different methods. The plots show the normalised coverage in 100 bp windows of increasing GC content in the human reference genome. NEBNextUltra libraries had higher read coverage in AT rich regions, whilst TruSeq DNA Methylation had increased read coverage of GC rich regions. The AccelNGS Methyl-Seq and SPLAT libraries displayed a lower GC bias, however regions with extreme GC content were not well represented. (B) Cumulative coverage of different genomic regions. Coverage plots for the whole genome is shown in in green, CpG islands in purple, FANTOM5 enhancer regions in blue and a set of 1000 promoter regions that are difficult to sequence due to high GC content in grey.

