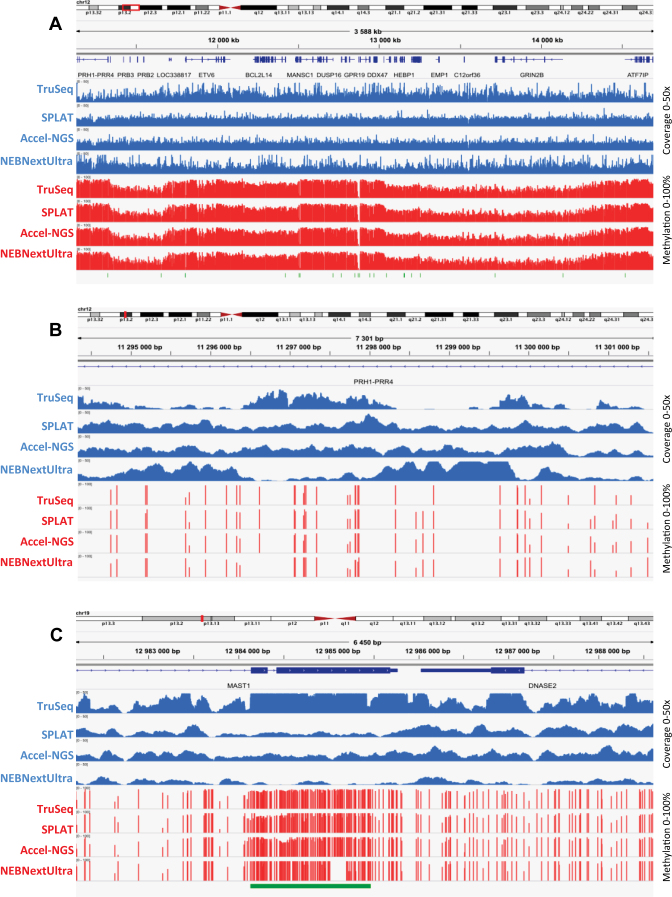
Figure 4.
Genome browser views displaying coverage and methylation tracks for the four different WGBS libraries generated from the NA10860 cell type. The blue tracks represent the read coverage, the red tracks represent the methylation levels across the regions and the green bars at the bottom of the panels represent CpG islands. (A) Read coverage and methylation levels across a 3.5 Mb region of chromosome 12. (B) Zoom-in view of a CpG poor 7.3 kb intergenic region on chromosome 12. (C) Zoom-in view of a 6.4 kb region containing a methylated CpG island on chromosome 19.

