Figure 3.
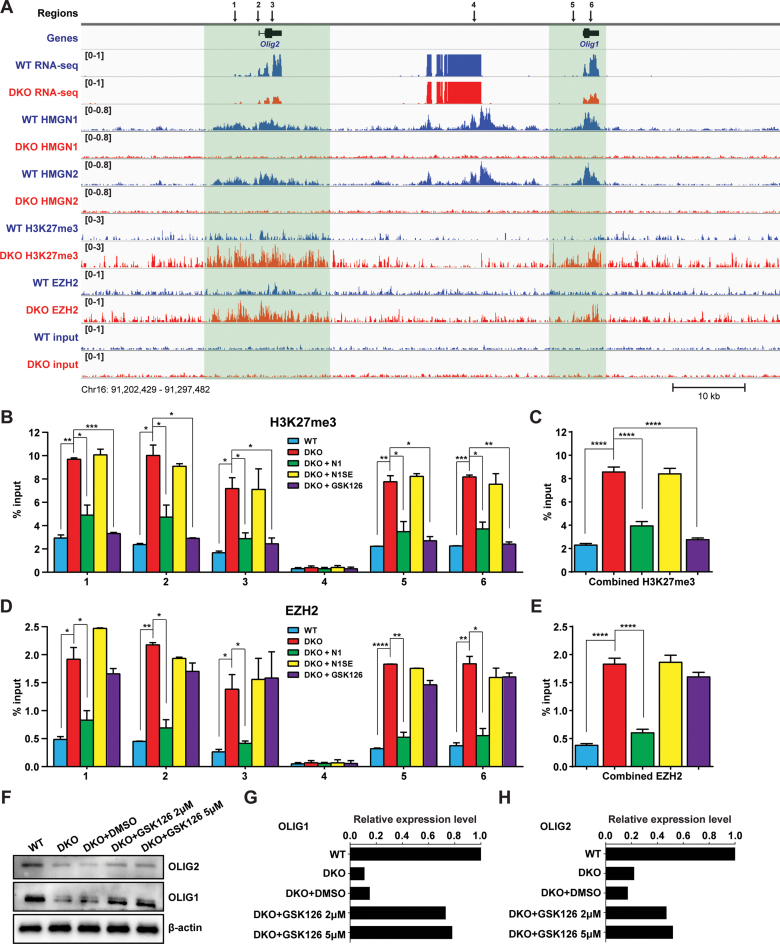
HMGNs modulate EZH2 binding and H3K27me3 levels around Olig1&2 genes. (A) Genome browser snapshot visualizes decreased mRNA and increased H3K27me3 and EZH2 levels at genic regions encompassing Olig1&2 in DKO ESCs. Numbers in parenthesis indicate the scales of the y-axis, in RPM. Input lanes show number of reads in the absence of antibody. (B–E) ChIP-qPCR analysis of H3K27me3 and EZH2 at the specific loci indicated by arrows in (A). Legend shows cell type. Combined values are shown in C and E. Data were obtained from two independent ESC clones (biological replicates) and presented as mean ± SEM. *P < 0.05, **P < 0.01, ***P < 0.001, ****P < 0.0001. IgG controls shown in supplemental Figure 3B. Primers used are listed in Supplementary Table S1. (F) Westerns showing OLIG1&2 expression in DKO ESCs treated with two concentrations of EZH2 specific inhibitor GSK126. (G–H) Quantifications of panel F, normalized to β-actin.

