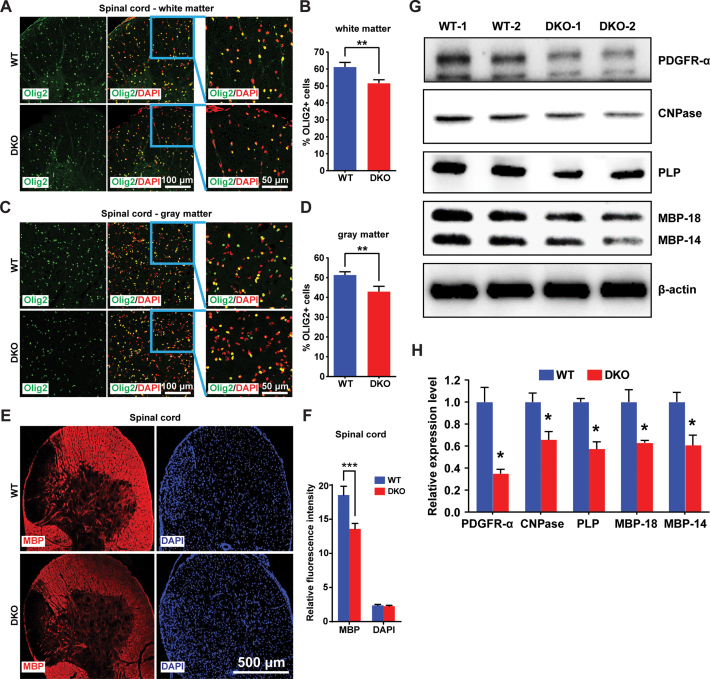
Figure 6.
Loss of HMGNs affects oligodendrocyte development in mouse spinal cord. (A–D) Immunofluorescence showing decreased OLIG2 positive cells in both white matter (A) and gray matter (C) of DKO mouse spinal cords. (B, D) Quantifications of four WT and four DKO mice. For each mouse, >1500 cells from six (white matter) or four (gray matter) different regions of spinal cord sections were counted. (E) Immunofluorescence showing decreased MBP level in DKO spinal cords. (F) Quantification of panel J, eight WT and eight DKO images were quantified by ImageJ. (G) Western blots showing the expression of oligodendrocyte markers in WT and DKO mouse spinal cords. (H) Quantifications of panel L, expression levels normalized to β-actin. All the data are presented as mean ± SEM (*P < 0.05, **P < 0.01, ***P < 0.001).

