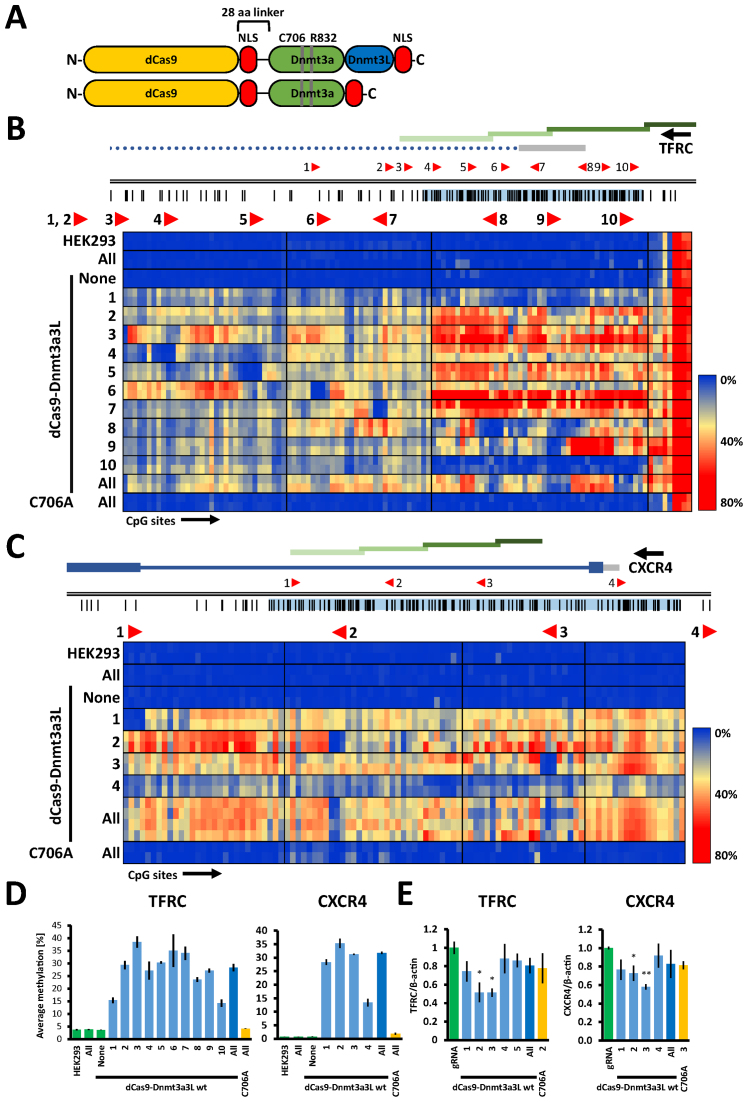
Figure 1.
The dCas9–Dnmt3a3L fusion protein deposits DNA methylation at endogenous human TFRC and CXCR4 promoters in HEK293 cells. (A) Schematic structure of the dCas9–Dnmt3a3L and Dnmt3a CD fusion proteins. The catalytically inactive dCas9 gene was fused to an engineered Dnmt3a–Dnmt3L C-terminal domain single-chain construct or Dnmt3a C-terminal domain with a 28 amino acid linker (containing NLS peptide). An additional NLS was added at the C-termini of both constructs. The residues that were mutated in this study within the catalytic domain of Dnmt3a in both Dnmt3a CD and Dnmt3a3L proteins are indicated (C706A inactivates the methyltransferase and R832E disrupts the multimerization of Dnmt3a). Not drawn to scale. (B) Genomic region of the human TFRC promoter that was targeted with the dCas9 fusions (Chr. 3: 196081310–196082794). Regions analyzed by bisulfite sequencing are indicated with green bars. The location and directionality of the Cas9 target sites are shown by red arrow heads. The black vertical lines indicate CpG sites. The gray bar denotes the 5΄ UTR and the dotted line represents an intron. The heat map shows average methylation per CpG site. Rows represent separate HEK293 co-transfection experiments where targeted methylation was induced with single or pooled gRNAs targeting the annotated region, columns represent separate CpG sites in the investigated region. Direction of the transcription is indicated with black arrow above the gene name. (C) Targeted methylation of the CXCR4 promoter in HEK293 cells (Chr.2: 136116618–136117805) illustrated as described in (B). The heat map shows acquisition of DNA methylation in the CXCR4 promoter region when targeting the dCas9–Dnmt3a3L with single or pooled gRNAs. (D) Average DNA methylation over all CpG sites within the analyzed regions in the HEK293 cells that were co-transfected with single or pools of gRNA. The analyzed TFRC and CXCR4 regions comprise 118 and 101 CpG sites respectively. The error bars denote STDEV from methylation averages measured in two biological samples. Color of the bars denotes experimental sets: green—control experiments, light blue—targeting of the dCas9 fusions with single gRNAs, dark blue—targeting with multiple gRNAs and yellow corresponds to targeting of C706A catalytic mutant. (E) Relative mRNA expression of TFRC and CXCR4 in the cells co-transfected with dCas9–Dnmt3a3L and single or pools of gRNAs as determined by RT-qPCR (error bars represent SEM from at least two biological replicates performed in technical triplicate). *P < 0.05, **P < 0.0001, unpaired t-test relative to ‘gRNA only’ control experiment.

