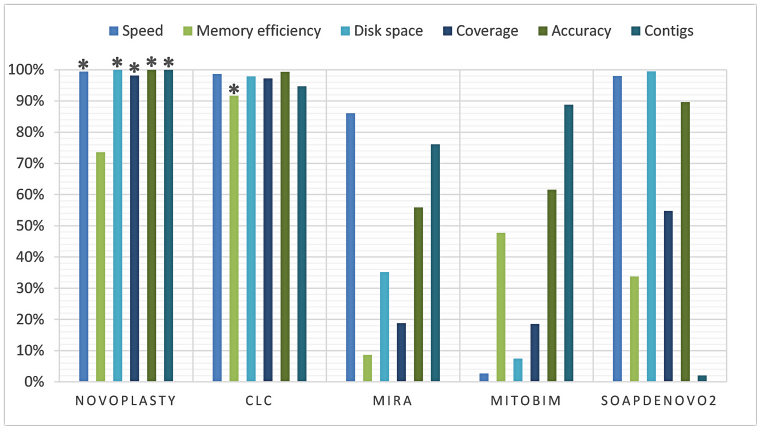
Figure 4.
Score graph derived from the benchmark study. Each property of each assembler was given a score proportional to the other assemblers. Each score was based on the average results of seven assemblies and expressed in percentage. A score of 100% is always seen as most favorable, more detailed explanation can be found in the ‘Quality assessment’ section of Materials and Methods. (*) Highest score for the corresponding property.

