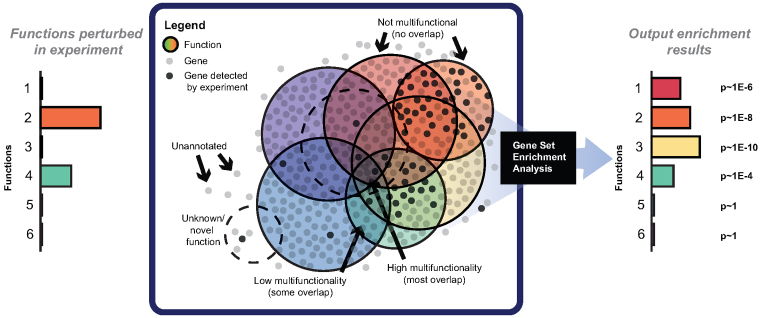
Figure 1.
A conceptual model for gene group analysis. Consider a hypothetical process (e.g. a disease) which involves two gene functions (bars at left). Assume a gene is ‘detected’ in the experiment (with some non-zero probability) if they are involved in one of the functions that underlie the process of interest. In this case, the genes with the highest probability of ‘showing up’ are the ones in functions 2 and 4. From a gene set enrichment analysis of this hit list, it is hoped that enrichment will be found for both functions 2 and 4, but not the others. Yet, genes in these functions are highly multifunctional and share other functions, which show up erroneously as enriched in the analysis (bars on the right).

