Figure 3.
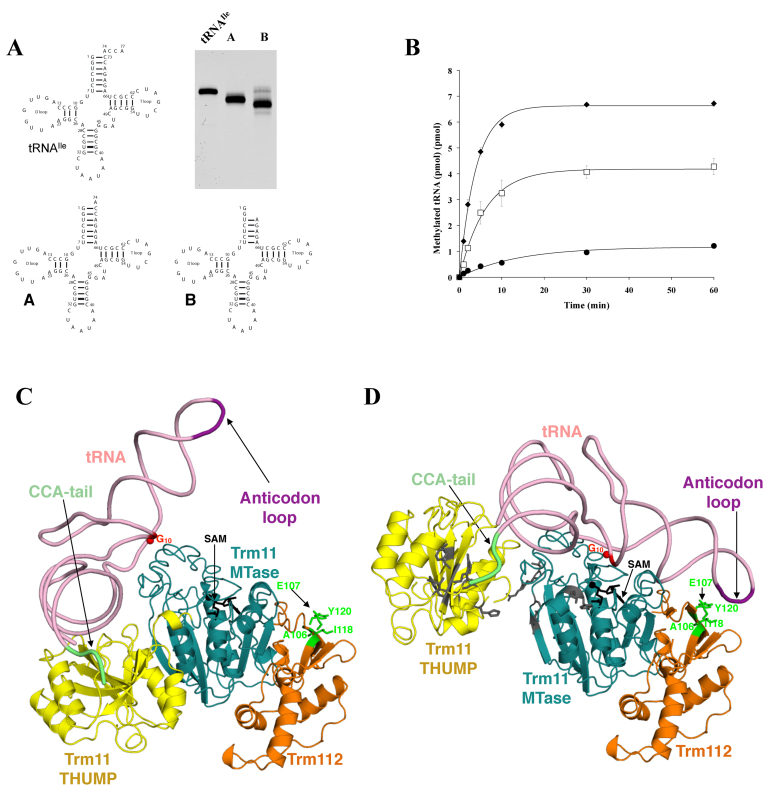
Trm11–Trm112 recognizes the intact tRNA molecule. (A) Schematic representation of full-length yeast tRNAIle and two truncated tRNA molecules (A and B). Analysis of the various transcripts by denaturing 10% polyacrylamide gel electrophoresis. The gel was stained by ethidium bromide. (B) Enzymatic activity of Trm11–Trm112 complex on intact tRNAIle (black diamond), transcripts A (open square) and B (filled circle). The curves obtained after fitting of the experimental data with equation given in the ‘Materials and Methods’ section are shown by solid lines. (C) Preliminary model of the Trm11–Trm112–tRNA complex. The SAM molecule modeled into Trm11 MTase domain is shown as black sticks. The tRNA G10 position is shown by a red sphere. Trm112 residues mutated in this study are shown as sticks in green. (D) Model of the Trm11–Trm112–tRNA complex obtained after rotation of the THUMP domain relative to the MTase domain. Same color code as panel C. Residues from Saccharomyces cerevisiae Trm11 corresponding to TkoTrm11 residues mutated by Hirata and coworkers are shown as gray sticks (32).

